|
|
|
|
|
|
|
Seismic Stratigraphy
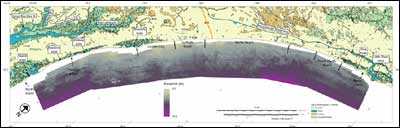
Regionally Defined Transgressive UnconformityTruncation of both underlying continental shelf deposits and incised paleochannels enable mapping of a major erosional unconformity throughout the area. This surface serves as the major bounding unconformity separating underlying geologically older units and overlying younger sedimentary shelf deposits. The unconformity likely represents a recent transgression of the marine environment. However, because it is the only regionally mappable unconformity of this magnitude, the surface may represent erosion caused by multiple periods of transgression, regression and subaerial exposure. Figure 16 illustrates the elevation of the transgressive surface as mapped from the CHIRP sub-bottom profiles. For much of the study area, this surface coincides with the seafloor, and closely resembles the bathymetric map of the area (Figure 2). This is primarily due to a lack of sediment supply throughout the area, which allows underlying strata (continental shelf and paleochannel fill) to crop out at the seafloor (Figures 12 and 13). In these areas, the surface is considered to be undergoing active modification by day-to-day hydrodynamic processes. Where lenses of surficial sediment are thick, the surface deviates from the regional bathymetry (Figures 2, 16 and 17). No major deviations from the general slope of the coast are recognized on this surface throughout the area.
|