Data Series 931
| Data ProcessingShoreline DataInterpolated MHW ShorelineFor alongshore surveys conducted from October 2012 to September 2013, the MHW shoreline was derived from the field data by using an interpolation method that creates a series of equally spaced profiles between the two survey lines that flank the MHW contour. The foreshore slope was assumed to be uniform on each profile. Using this slope and the elevation values where the profile intersects the alongshore survey line, a simple geometric calculation was done to find the location where each profile line intersected the MHW elevation. The interpolated MHW locations are stored as points, and a line is assembled to represent the position of the interpolated MHW shoreline. Extracted MHW ShorelineFor alongshore surveys completed in January 2014 and later, a new survey approach was implemented that was designed to improve surface interpolation by collecting an additional network of xyz points along the beach face, focused in and around the MHW elevation. For these surveys, alongshore data were collected at the berm crest, low water mark, and mid-beach face. In addition, data was collected following a sinusoidal alongshore path from the water’s edge to the top of the berm crest at approximately 45 degrees to the orientation of the shoreline (fig. 6). The xyz data were used to create an interpolated surface from which the MHW contour was extracted.  Figure 6. Example of field data-collection methods. Original method (top panel) with distribution from dune to lower beach face. Modified data sampling (bottom panel) with additional concentration around the beach face designed to capture more data points at the MHW elevation (0.46 m NAVD 88). Base imagery is 2004 Suffolk County NY Orthophotography (NYGIS).[larger version] Profile DataProfile TranslationExisting profiles used in previous (unpublished) analyses, were used to determine the collection location and reference for the subsequent pre- and post-Sandy cross-shore data collection. These reference profile locations were created using ArcGIS and formatted as shapefiles. In the field, the positions of the reference profiles were located using a field tablet, and the field team attempted to collect DGPS data along these profile locations. However, the resulting horizontal position of the surveyed profile data varied (10-40 m) from the reference profiles due to field conditions during data collection. We developed a method to relate the field collected data to their corresponding reference profiles so all profile data could be plotted together (figure 7A). Transects were cast from a shore perpendicular baseline to ensure transects would be parallel to shoreline features such as the berm crest and dune toe. These shore parallel transects were then used to relate the reference profile to all field collected data (figure 7B). A full description of the profile translation is available in the process steps of the profile metadata. 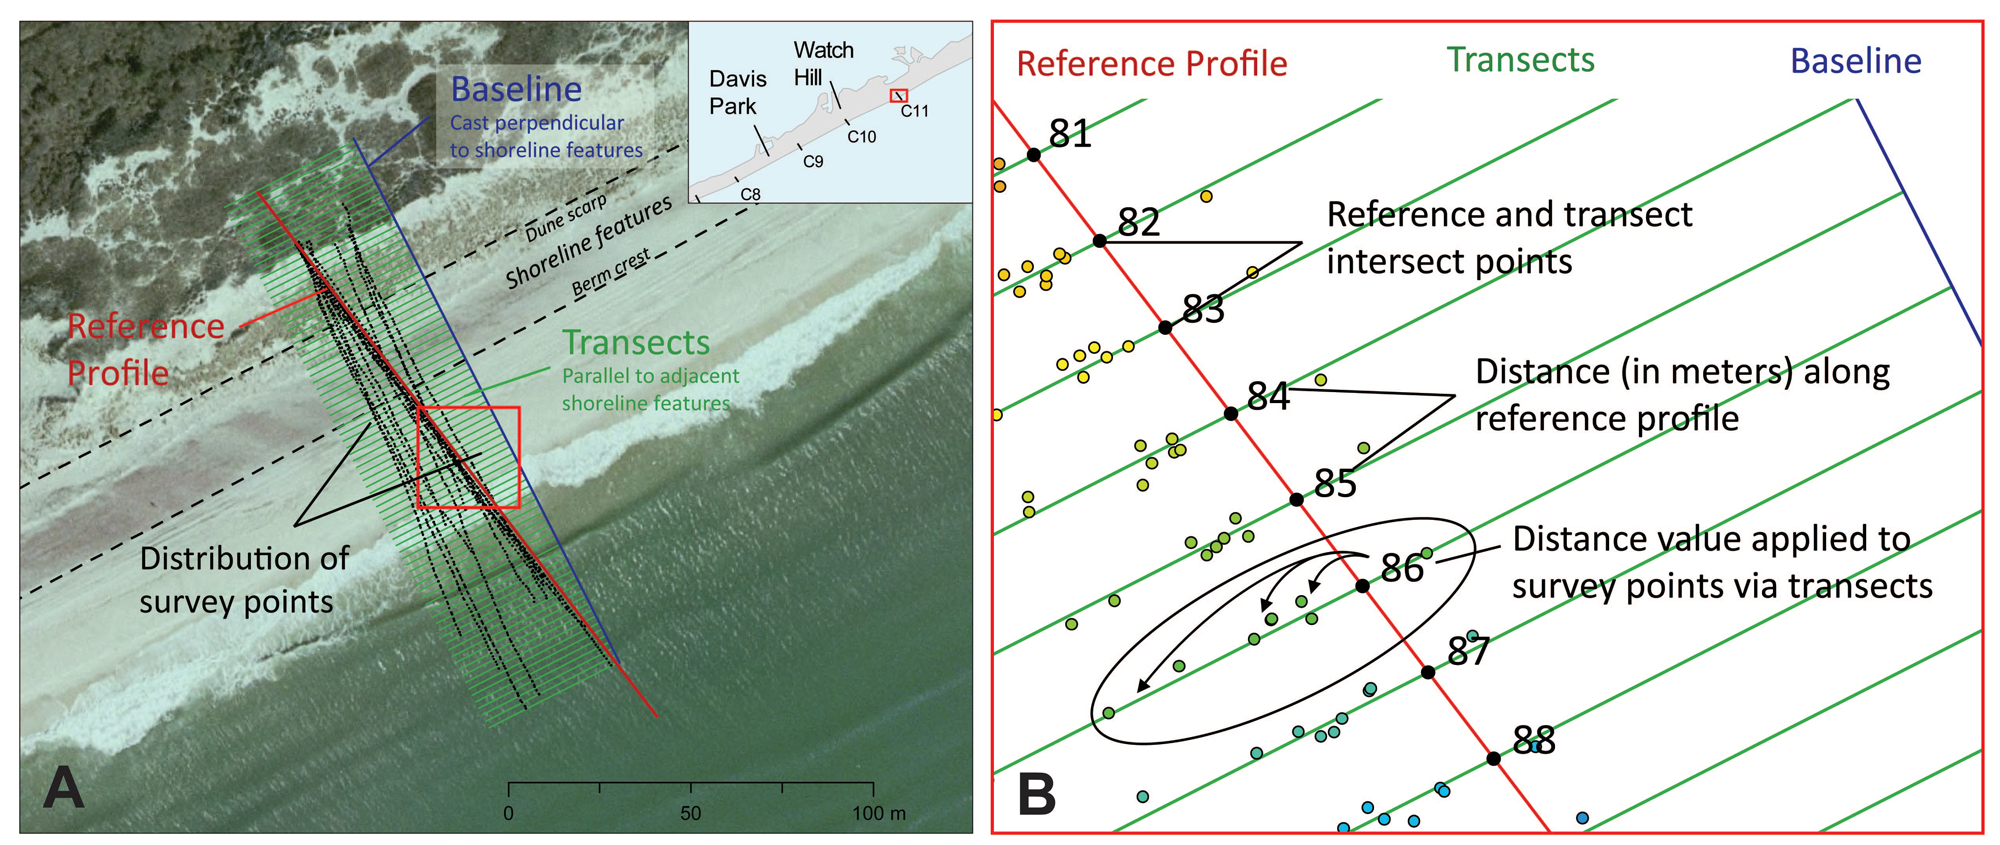 Figure 7. A) Reference profile in relation to field collected data, baseline, transects and shore parallel shoreline features. B) Translation of distance measurement to all field collected data. [larger version] |

![]() U.S. Department of the Interior |
U.S. Geological Survey
U.S. Department of the Interior |
U.S. Geological Survey
URL: http://pubsdata.usgs.gov/pubs/ds/0931/ds931_data-processing.html
Page Contact Information: GS Pubs Web Contact
Page Last Modified: Monday, 28-Nov-2016 20:35:35 EST
