Data Series 931
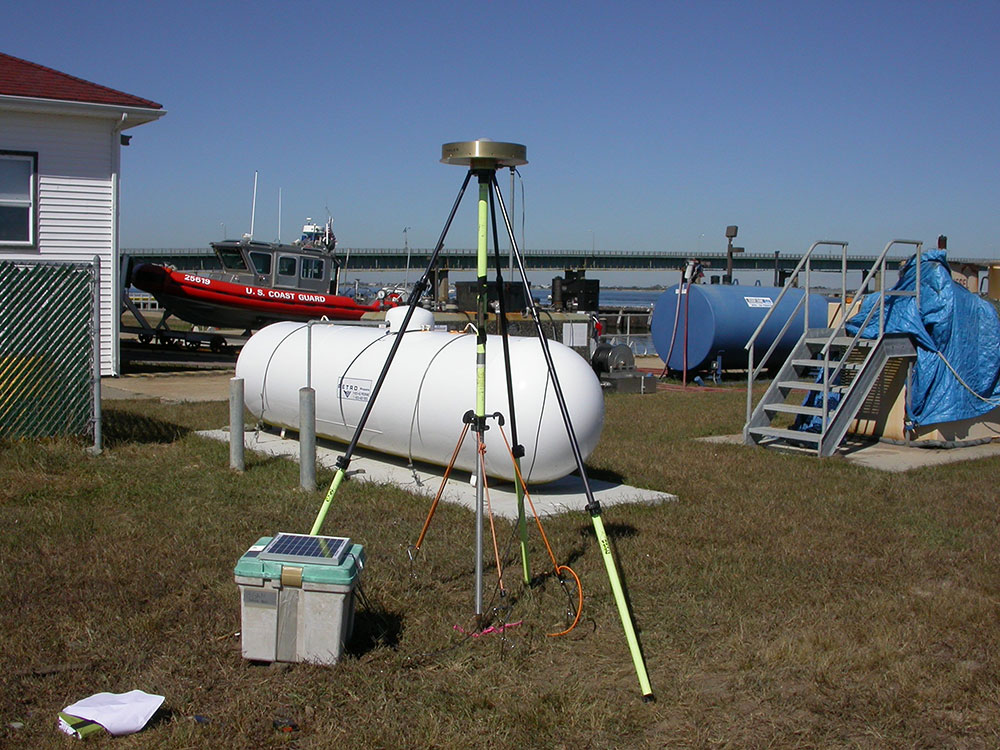
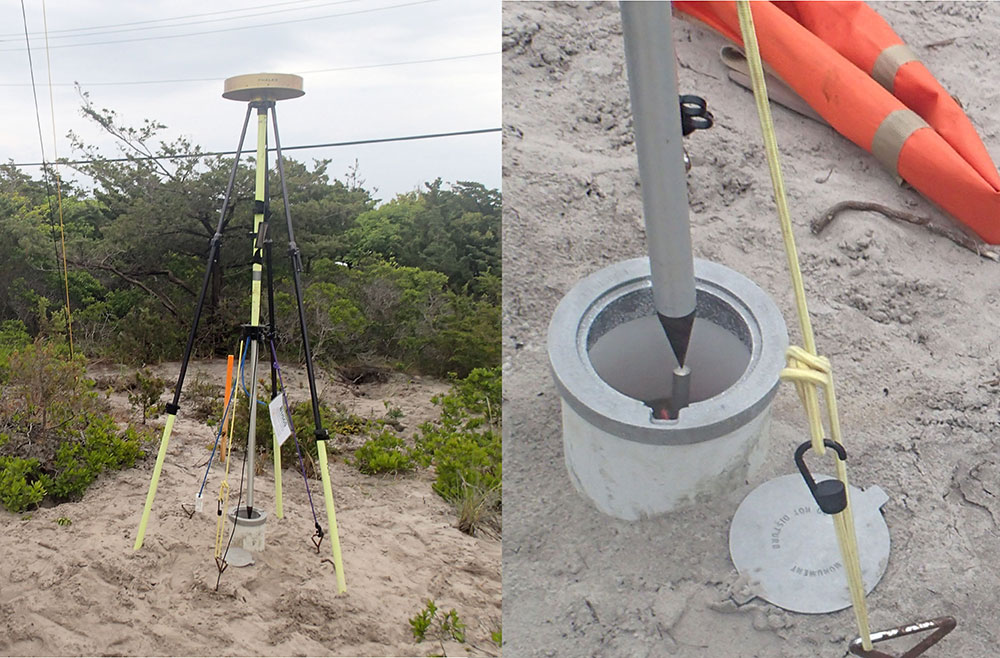
| Survey OverviewPrior to and following Hurricane Sandy in October, 2012, DGPS data were collected alongshore and cross-shore to assess the morphologic impacts of the storm. The survey effort began one day prior to landfall (October 28, 2012), and was repeated three days following the storm (Nov 01, 2012), and at monthly and bi-monthly intervals for 24 months (to October 2014). Data were collected at 0.5-second intervals using an Ashtech Z-Xtreme GPS surveying instrument, and post-processed using positional data from a base receiver to achieve sub-decimeter accuracies. Cross-shore profiles were collected in western and central regions of Fire Island to capture the storm response in areas that vary morphologically and geologically. In all, ten profile locations were surveyed, extending from just inland of the crest of the dune to the low-tide swash zone. The cross shore profile surveys covered sixteen dates from October 28, 2012 to October 07, 2014. Alongshore data were collected on shore-parallel tracks to capture the base of the dune, the mid-beach, and the upper and lower foreshore. Over the course of 23 months, 13 surveys were conducted collecting data along shore-parallel tracks to capture the upper and lower foreshore. The alongshore tracks extend from the western boundary of Fire Island National Seashore to the western flank of the Wilderness breach. Base StationThe original base station at the Fire Island Coast Guard (FICG) station was set on a control point established by the USGS (fig. 2). The control point was established from multiple GPS occupations and processed using the National Geodetic Survey (NGS)—Online Positioning User Service (OPUS) (http://www.ngs.noaa.gov/OPUS/). The control point was referenced to the North American Datum of 1983 (NAD 83) (CORS96) ellipsoid. This base station was used for surveys conducted from October 2012 through January 2014. In the spring of 2014, a permanent survey marker was placed at Robbins Rest (REST) by the National Park Service (fig. 3). The control for REST was established using multiple GPS occupations, processed using OPUS, and referenced to NAD 83 (CORS96). This station was used for June and September 2014 surveys and can be used for future surveys.
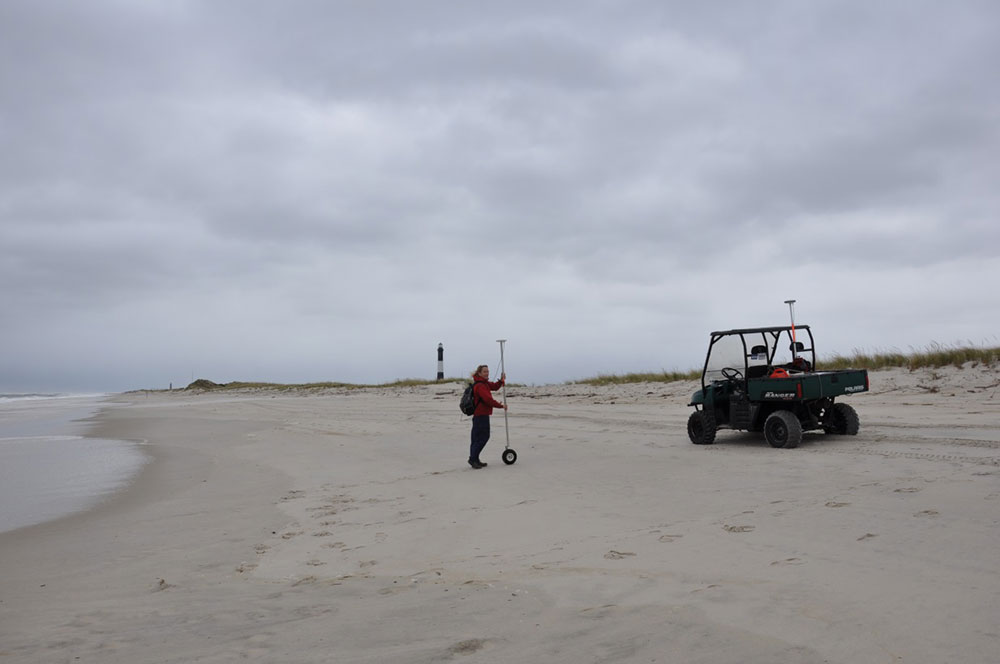
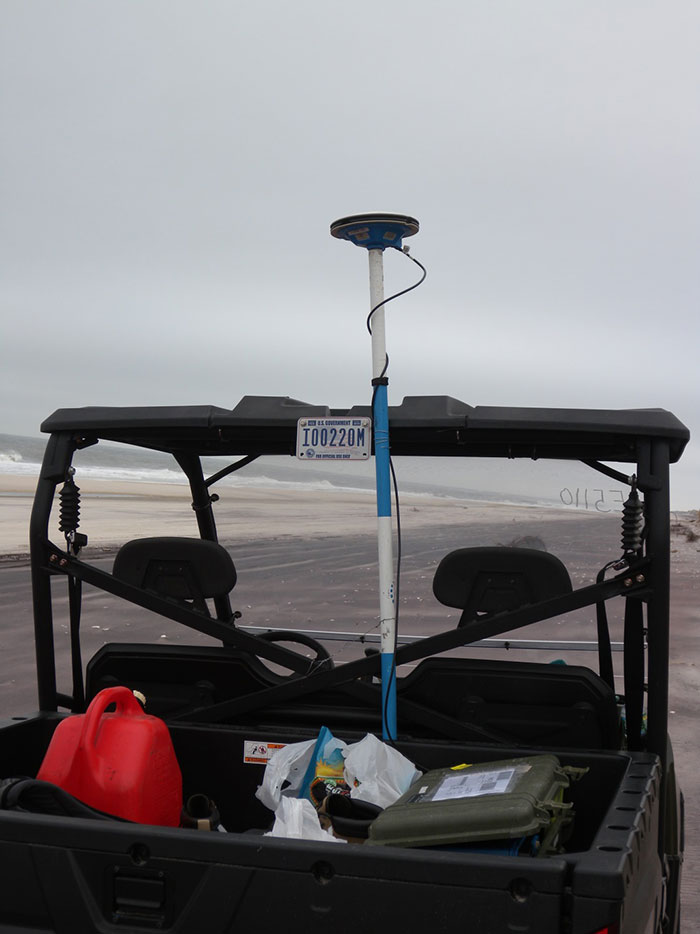
Survey Equipment and SetupSurvey equipment included Asthech Z-Xtreme receivers, Ashtech Choke Ring antenna, Ashtech Geodetic antenna, fixed height tripods, GPS staff affixed to a wheel, and GPS staff affixed to a Polaris ATV. The rover antenna was attached to the ATV by inserting a survey rod into one of the holes in the edge of the cargo bed and hose-clamping to one of the roof supports (fig. 4). Post-ProcessingRaw L1/L2 phase data were collected at the base and at the rover, and the data were post-processed. Post-processing of base data was accomplished by using OPUS, and transformations were done using NGS Horizontal Time-Dependent Positioning (HTDP) (http://www.ngs.noaa.gov/TOOLS/Htdp/Htdp.shtml). Post-processing of kinematic data was done using Novatel/Waypoint Grafnav software. Differential correction post-processing software was used to correct the rover with the control points (FICG or REST) described above. Quality-Control MeasuresError sources for GPS data collection can be broken down into two categories: uncontrollable random error associated with the signal itself or systematic error associated with the collection of the signal. Since there is no way to control the random error, precautions were taken to minimize the systematic error. To do this the following quality-control measures were implemented in the field. On all base occupations, fixed-height tripods with bubble levels were used to ensure accurate height and true vertical positioning, while tie downs and weighted legs were used to keep the tripod from shifting during data collection (figs. 2–3). A fixed-height wheeled mount (fig. 4) was used for hand-surveying cross-shore profiles. Antenna height for the rover (fig. 5) was measured by hand, using an average of multiple measurements, and a bubble level was used to ensure the antenna placement was as close to true vertical as possible. Finally, to ensure that the control point had not been disturbed between surveys, each base station occupation used for rover control was run through OPUS to ensure its integrity.
|

![]() U.S. Department of the Interior |
U.S. Geological Survey
U.S. Department of the Interior |
U.S. Geological Survey
URL: http://pubsdata.usgs.gov/pubs/ds/0931/ds931_survey-overview.html
Page Contact Information: GS Pubs Web Contact
Page Last Modified: Monday, 28-Nov-2016 20:35:37 EST