Data Series 999
| Introduction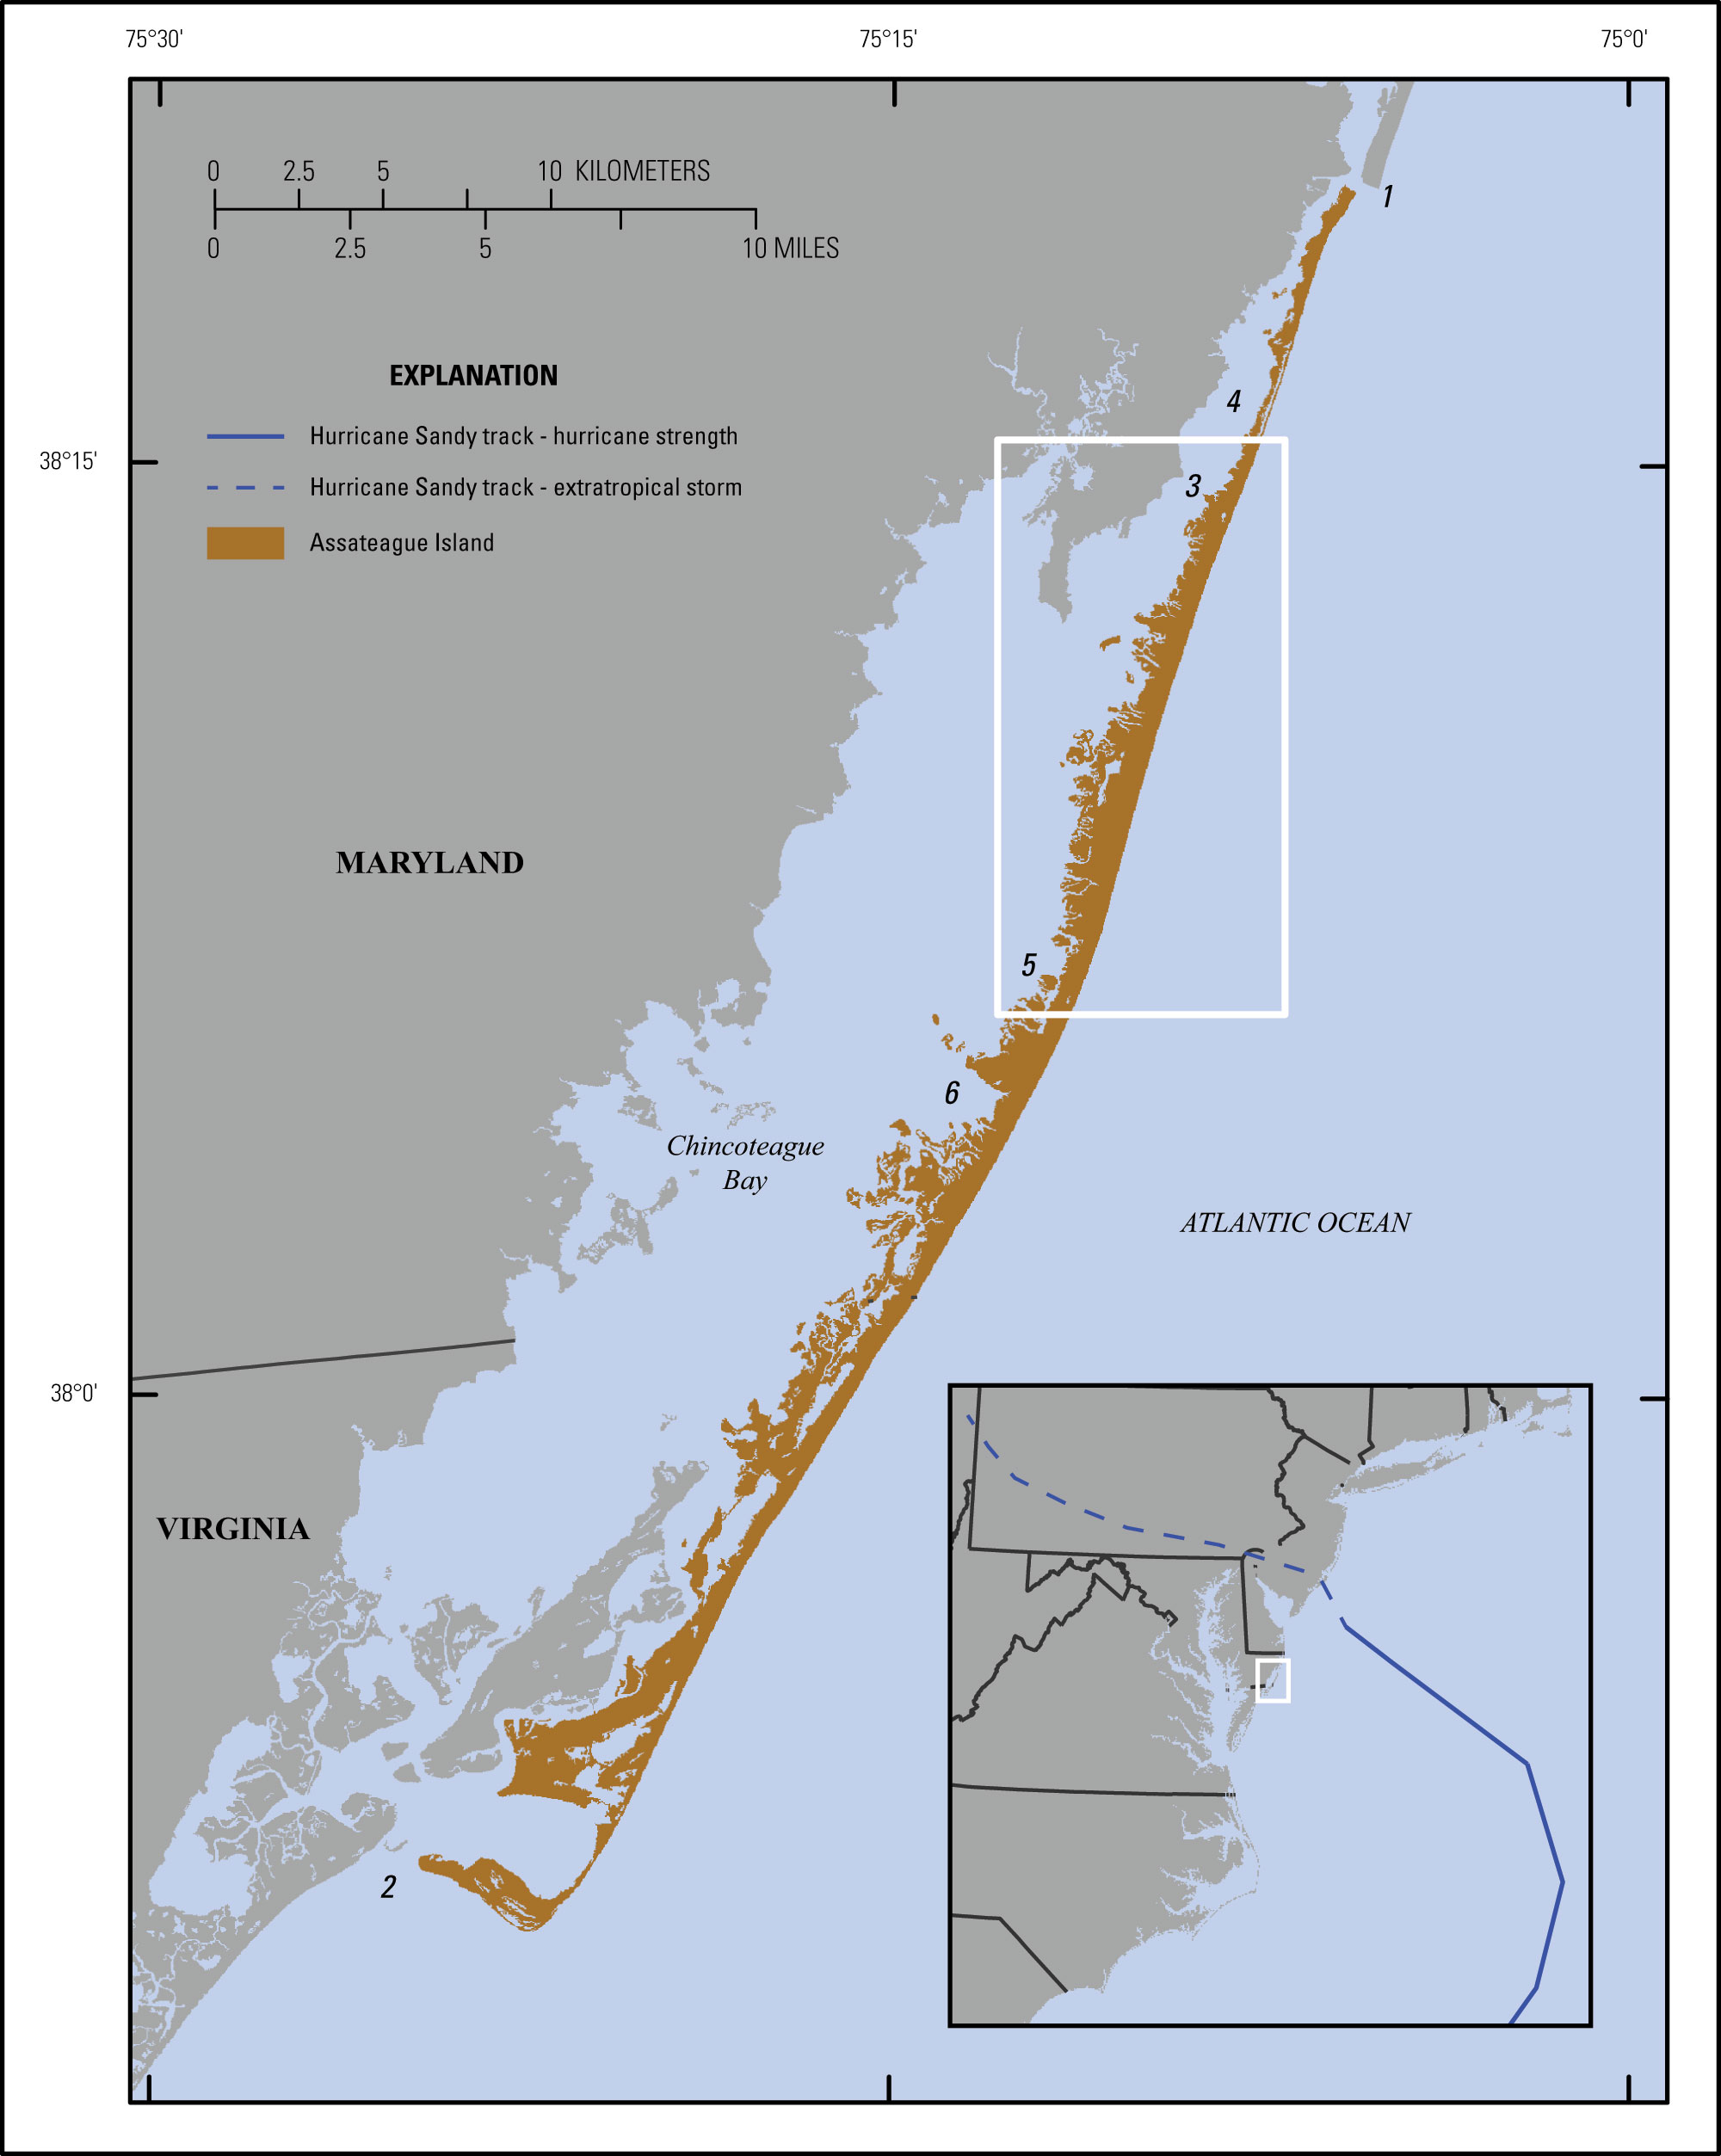 Figure 1. Regional map of Assateague Island, Maryland and Virginia. White box indicates study-area extent. Numbered features are (1) Ocean City Inlet, (2) Chincoteague Inlet, (3) Verrazano Bridge Causeway, (4) Sinepuxent Bay, (5) Fox Hills Level, and (6) Green Run Bay. Inset shows track of Hurricane Sandy offshore of the U.S. Atlantic coast. Base map modified from U.S. Geological Survey 1:200,000 scale digital data overlaid with coastal land area derived from Landsat 5 imagery acquired April 28, 1989. [Click image to enlarge] Hurricane Sandy made landfall near Brigantine, New Jersey, on October 29, 2012, after becoming the largest Atlantic tropical cyclone in the National Hurricane Center’s extended best track record. At its maximum extent, tropical-storm-force winds from Hurricane Sandy extended more than 1,500 kilometers (km) (870 nautical miles) from the eye (Blake and others, 2013). Hurricane Sandy tracked approximately parallel to the U.S. Atlantic coast before turning to the northwest and making landfall as an extratropical storm, impacting large extents of the eastern seaboard from North Carolina to Massachusetts with rain, winds, waves, and storm surge (fig. 1). The U.S. Geological Survey’s (USGS) National Assessment of Coastal Change Hazards program has a long history of responding to and documenting the impacts of storms along the Nation’s coasts and incorporating these data into storm impact and coastal change vulnerability assessments. Although physical changes caused by tropical and extratropical storms to the sandy beaches and dunes fronting barrier islands are generally well documented, the interaction between sandy shoreline erosion and overwash with the back-barrier wetland and estuarine environments is poorly constrained. In response to Hurricane Sandy (Buxton and others, 2013), data were collected by the USGS as part of the Storm Impacts and Vulnerability of Coastal Beaches, Barrier Island and Estuarine Wetland Physical Change Assessment (BIWC), and Estuarine Physical Response to Storms projects to evaluate and update coastal change models and predictive capabilities (for example, see Stockdon and others, 2013; Sopkin and others, 2014; Bernier and others, 2015; Ellis and others, 2015; Guy, 2015; Smith and others, 2015). The goal of the BIWC is to integrate a wetland-change assessment with existing coastal-change assessments for the adjacent sandy dunes and beaches, initially focusing on Assateague Island along the Maryland and Virginia coastline (fig. 1). Assateague Island is approximately 60 km (about 37 miles) long, extending from Ocean City Inlet in the north to Chincoteague Inlet in the south, and is separated from the mainland by the Chincoteague Bay estuary. Assateague Island is largely undeveloped and is managed by the National Park Service (NPS) (Assateague Island National Seashore), the U.S. Fish and Wildlife Service (Chincoteague National Wildlife Refuge), and the Maryland Park Service (Assateague State Park). Beach, dune, forested, shrub, and wetland environments on the island provide habitat for and support a diverse wildlife and shorebird population, including wild horses and the endangered piping plover (Carruthers and others, 2011; Gieder and others, 2014). The geomorphology of this wave-dominated barrier island is especially influenced by overwash and breaching events resulting from the passage of tropical storms and hurricanes in the summer and extra-tropical “nor ‘easters” in the fall and winter (Carruthers and others, 2011). The storm surge from Hurricane Sandy ranged from about 1.1 to 1.5 meters (m) (3.5 to 5 feet) above mean higher high water (Blake and others, 2013) along the Maryland and Virginia coastline encompassing Assateague Island. Analysis of pre- and post-storm lidar topography and aerial photography showed changes to the sandy ocean-facing shoreline on Assateague Island that varied from erosion and scarping along the beach and dune face to erosion and overwash of low-lying berms and dunes (Sopkin and others, 2014; Guy, 2015). Storm-induced overwash transported sediment-laden water across the beach and dune environments, depositing sandy sediments (washover deposits) in the back-barrier environments. This report describes sediment data from sand auger cores collected from active overwash zones on Assateague Island in Maryland (fig. 1). Samples were collected during two surveys in March/April and October, 2014 (USGS Field Activity Numbers [FAN] 2014-301-FA and 2014-322-FA, respectively). These data, including sample location tables, descriptive core logs, core photographs and x-radiographs, and results of sediment grain-size analyses, can be downloaded from the Data Downloads page. The physical characteristics (for example, sediment texture or bedding structure) of and spatial differences among these deposits will provide information about overwash processes and sediment transport from the sandy barrier-island reaches to the back-barrier environments. Metrics derived from these data, such as mean grain size or deposit thicknesses, can be used to ground-truth remote sensing and geophysical data and can also be incorporated into sediment transport models. |

![]() U.S. Department of the Interior |
U.S. Geological Survey
U.S. Department of the Interior |
U.S. Geological Survey
URL: http://pubsdata.usgs.gov/pubs/ds/0999/ds999_introduction.html
Page Contact Information: GS Pubs Web Contact
Page Last Modified: Monday, 28-Nov-2016 20:49:56 EST
