Data Series 1027
|
Accuracy and ErrorAn initial horizontal accuracy of the image data was assessed by Fugro Earthdata Inc., using 188 GCPs provided by GCMRC. The GCPs were marked during image acquisition with 1-square-meter (m2) diagonally alternating black and white plastic panels centered on control points throughout the river corridor in the GCMRC survey-control network (Hazel and others, 2008). The root mean square error (RMSE) reported by Fugro Earthdata Inc. is 0.17 m easting and 0.15 m northing, or better, depending on the acquisition zone. After mosaicking, we assessed the horizontal accuracy of the 2013 data postregistration to the 2009 imagery. We completed three horizontal-accuracy assessments that are relevant for the 2013 image mosaic. We compared the 2013 mosaic to the GCMRC survey-control network, the 2013 mosaic to the 2009 mosaic, and the 2009 mosaic to the GCMRC survey-control network. All three assessments used the same 91 GCPs that coincided in the 2009 and 2013 data acquisitions. A total of 95 GCPs actually coincided between 2009 and 2013; however, we removed four outlier points that had large observed errors in 2013, which we believe resulted from misplacement or disturbance of a panel on a monument in the field (fig. 5). The accuracy assessments were completed by following the Federal Geographic Data Committee geospatial-positioning accuracy standard for calculating RMSE and accuracy at 95-percent confidence level (Federal Geographic Data Committee, 1998). First we calculated the sum of square error for each coordinate independently, then a combined sum of square error (SSE) for a combined error given by:
where C is either the x or y coordinate (easting, northing). Next we calculated mean square error (MSE) by taking the mean of our calculated sum of square errors for each coordinate and the total SSE:
We were then able to calculate RMSE separately for the x and y coordinates as follows:
Alternatively the above calculations can be accomplished in one step with the following:
where C is either the x or y coordinate (easting, northing). We then estimated accuracy at the 95-percent confidence level for the x and y coordinates as follows:
Next, we calculated the combined (or “total”) x and y RMSE as follows:
We then estimated the combined x and y accuracy at the 95-percent confidence level as follows:
When comparing the 2013 and 2009 image mosaics, we considered 2013 the “control” and 2009 the “image” dataset. When comparing the 2013 mosaic to the GCMRC survey-control network, we determined RMSEs of 0.26, 0.26, and 0.37 m for easting, northing, and combined, respectively, with 95-percent confidence-level accuracy estimates of 0.52, 0.50, 0.64 m (table 2), respectively. When comparing the 2013 and 2009 mosaics, we determined RMSEs of 0.17, 0.13, and 0.21 m for easting, northing, and combined, respectively, with 95-percent confidence level accuracy estimates of 0.33, 0.25, 0.37 m (table 3), respectively, indicating an RMSE nearly equal to the ground-sample distance (that is, length of one pixel) when comparing the 2013 and 2009 mosaics (for example, for change detection). A comparison of the 2009 mosaic with the GCMRC survey-control network was reported previously (Davis, 2012); however, we report the accuracy here by using equations 3 through 9 and the 91 coincident GCPs. When comparing the 2009 mosaic with the GCMRC survey-control network, we determined RMSEs of 0.28, 0.23, and 0.36 m for easting, northing, and combined, respectively, with 95-percent confidence level accuracy estimates of 0.55, 0.45, 0.63 m (table 4), respectively. One other important spatial-error component in the image data is associated with smear, which is generally presented as pixel-value drag across parts of the scene in this type of airborne remotely sensed data (Davis, 2012). These errors commonly appear at the edges of drastic topographic changes, such as sheer cliffs and scarps. In some places, no flightline tiles were smear free enough to use in the final mosaic dataset. We marked and recorded all areas that contained unavoidable smear, which accounted for 244,876 m2 or 0.0857 percent of the total image-mosaic area. 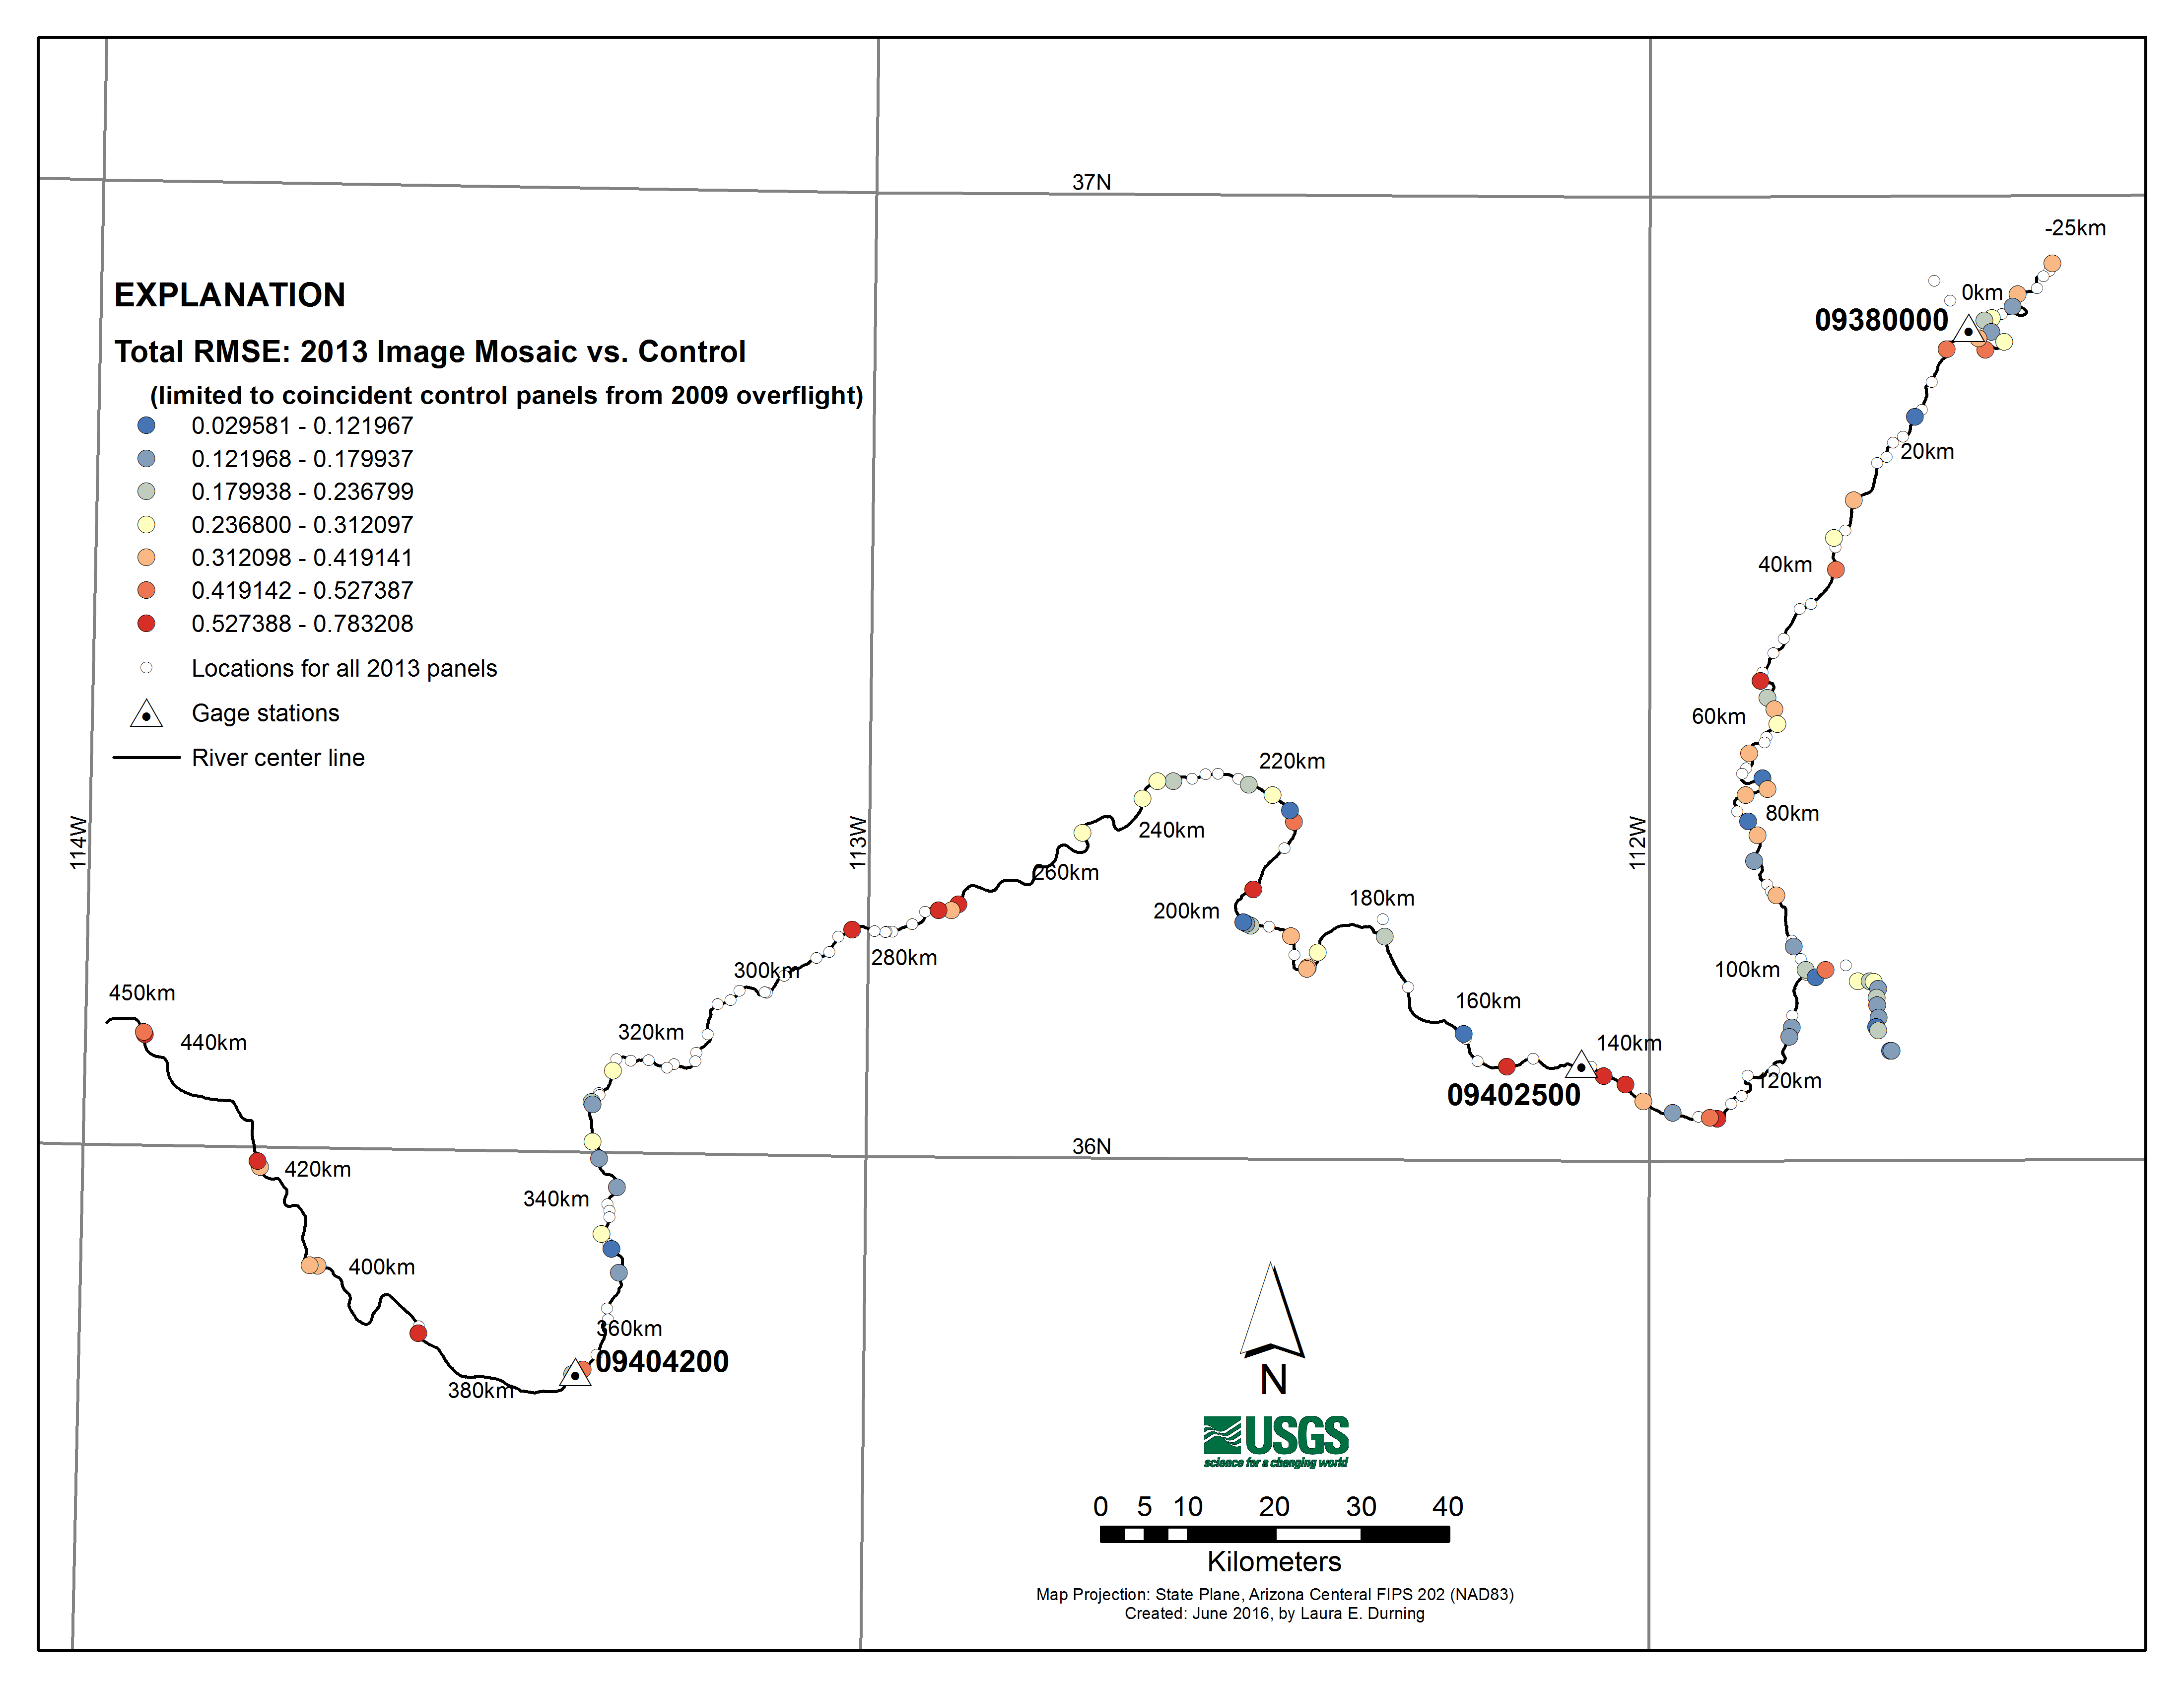 Figure 5. Map showing Colorado River in Grand Canyon and spatial locations for all ground-control points (GCPs) that had a placed panel in May 2013. Colored circles, panels used in accuracy assessment; small uncolored circles, panels omitted from accuracy assessment (for non-coincidence or placement error). Each circle is colored by combined (easting and northing) RMSE (RMSExy in equation 8) from comparison of U.S. Geological Survey’s Grand Canyon Monitoring and Research Center 213 mosaic with survey-control network. Table 2. Comparison of 2013 mosaic with GCMRC survey-control network (limited to n=91 GCPs coincident between 2013 and 2009 image-data acquisitions) Durning and Others, 2016.
Table 3. Comparison of 2013 and 2009 mosaics (limited to 91 GCPs coincident between 2013 and 2009 image-data acquisitions) Durning and Others, 2016.
Table 4. Comparison of 2009 mosaic with GCMRC survey-control network (limited to 91 GCPs coincident between 2013 and 2009 image-data acquisitions) Durning and Others, 2016.
|

![]() U.S. Department of the Interior |
U.S. Geological Survey
U.S. Department of the Interior |
U.S. Geological Survey
URL: http://pubsdata.usgs.gov/pubs/ds/1027/ds1027_accuracy.html
Page Contact Information: GS Pubs Web Contact
Page Last Modified: Monday, 12-Dec-2016 18:47:53 EST
