Data Series 1027
|
Data CollectionAirborne data were acquired from May 25 to 30, 2013, under contract by Fugro Earthdata Inc., by using two fixed-wing aircraft at altitudes of 2,440 to 3,350 m above mean sea level. GCMRC worked with the U.S. Department of Interior Bureau of Reclamation and other stakeholders of the GCDAMP to implement low steady release flows of about 227 cubic meters per second (m3/s) from Glen Canyon Dam during the entire period of data acquisition. The low steady release ensured that river discharge and the wetted shoreline of the river channel would be as stable and consistent as possible throughout the entire resulting dataset. As is demonstrated in figure 2, the discharge recorded at Lees Ferry varied somewhat about the targeted discharge of 227 m3/s, and additional flow from tributaries added to the discharge as the wave progressed through the canyon. Given the speed of the wave moving through the canyon, we had to closely project when the low steady flows would reach a given segment of the canyon in order for image acquisition to coincide with the targeted discharge; during the first few days of the mission, it was especially important that the aircraft did not proceed farther downstream than the low steady flow wave (table 1). The first flight was cleared to begin data collection at the dam at 10:30 mountain time (MT) on May 25, and the mission aircraft were given an all-clear to collect data throughout the entire river corridor at 20:00 on May 28. Data collection at the dam had to be completed by 04:00 on May 31, owing to the end of the targeted dam releases of 227 m3/s, and that deadline was met comfortably with the last flight at 12:32 on May 30. For any given section of the river corridor, five or six overlapping linear flightlines were acquired, allowing for the greatest probability of error-free and low-shadow imagery. The image data were acquired at a spatial resolution of 20 centimeters (cm) in four wavelength bands: near-infrared (NIR; 0.835–0.885 microns [µm]), red (0.610–0.660 µm), green (0.535–0.585 µm), and blue (0.430–0.490 µm). The data were acquired with one Leica ADS80/82 pushbroom sensor each mounted on two aircraft. The sensor collected multispectral data at the following viewing angles simultaneously along the flight track: RGB and NIR at 0° nadir, RGB and NIR at 16° backward, Panchromatic at 27° forward, Panchromatic at 14° backward, and Panchromatic at 2° forward. These data were orthorectified by using 188 ground-control points (GCPs) provided by GCMRC to the flight contractor. The contractor delivered the orthorectified data to GCMRC in 16-bit TIFF format. The data were collected in 43 flightlines and subdivided into 1,100 tiles by the contractor. 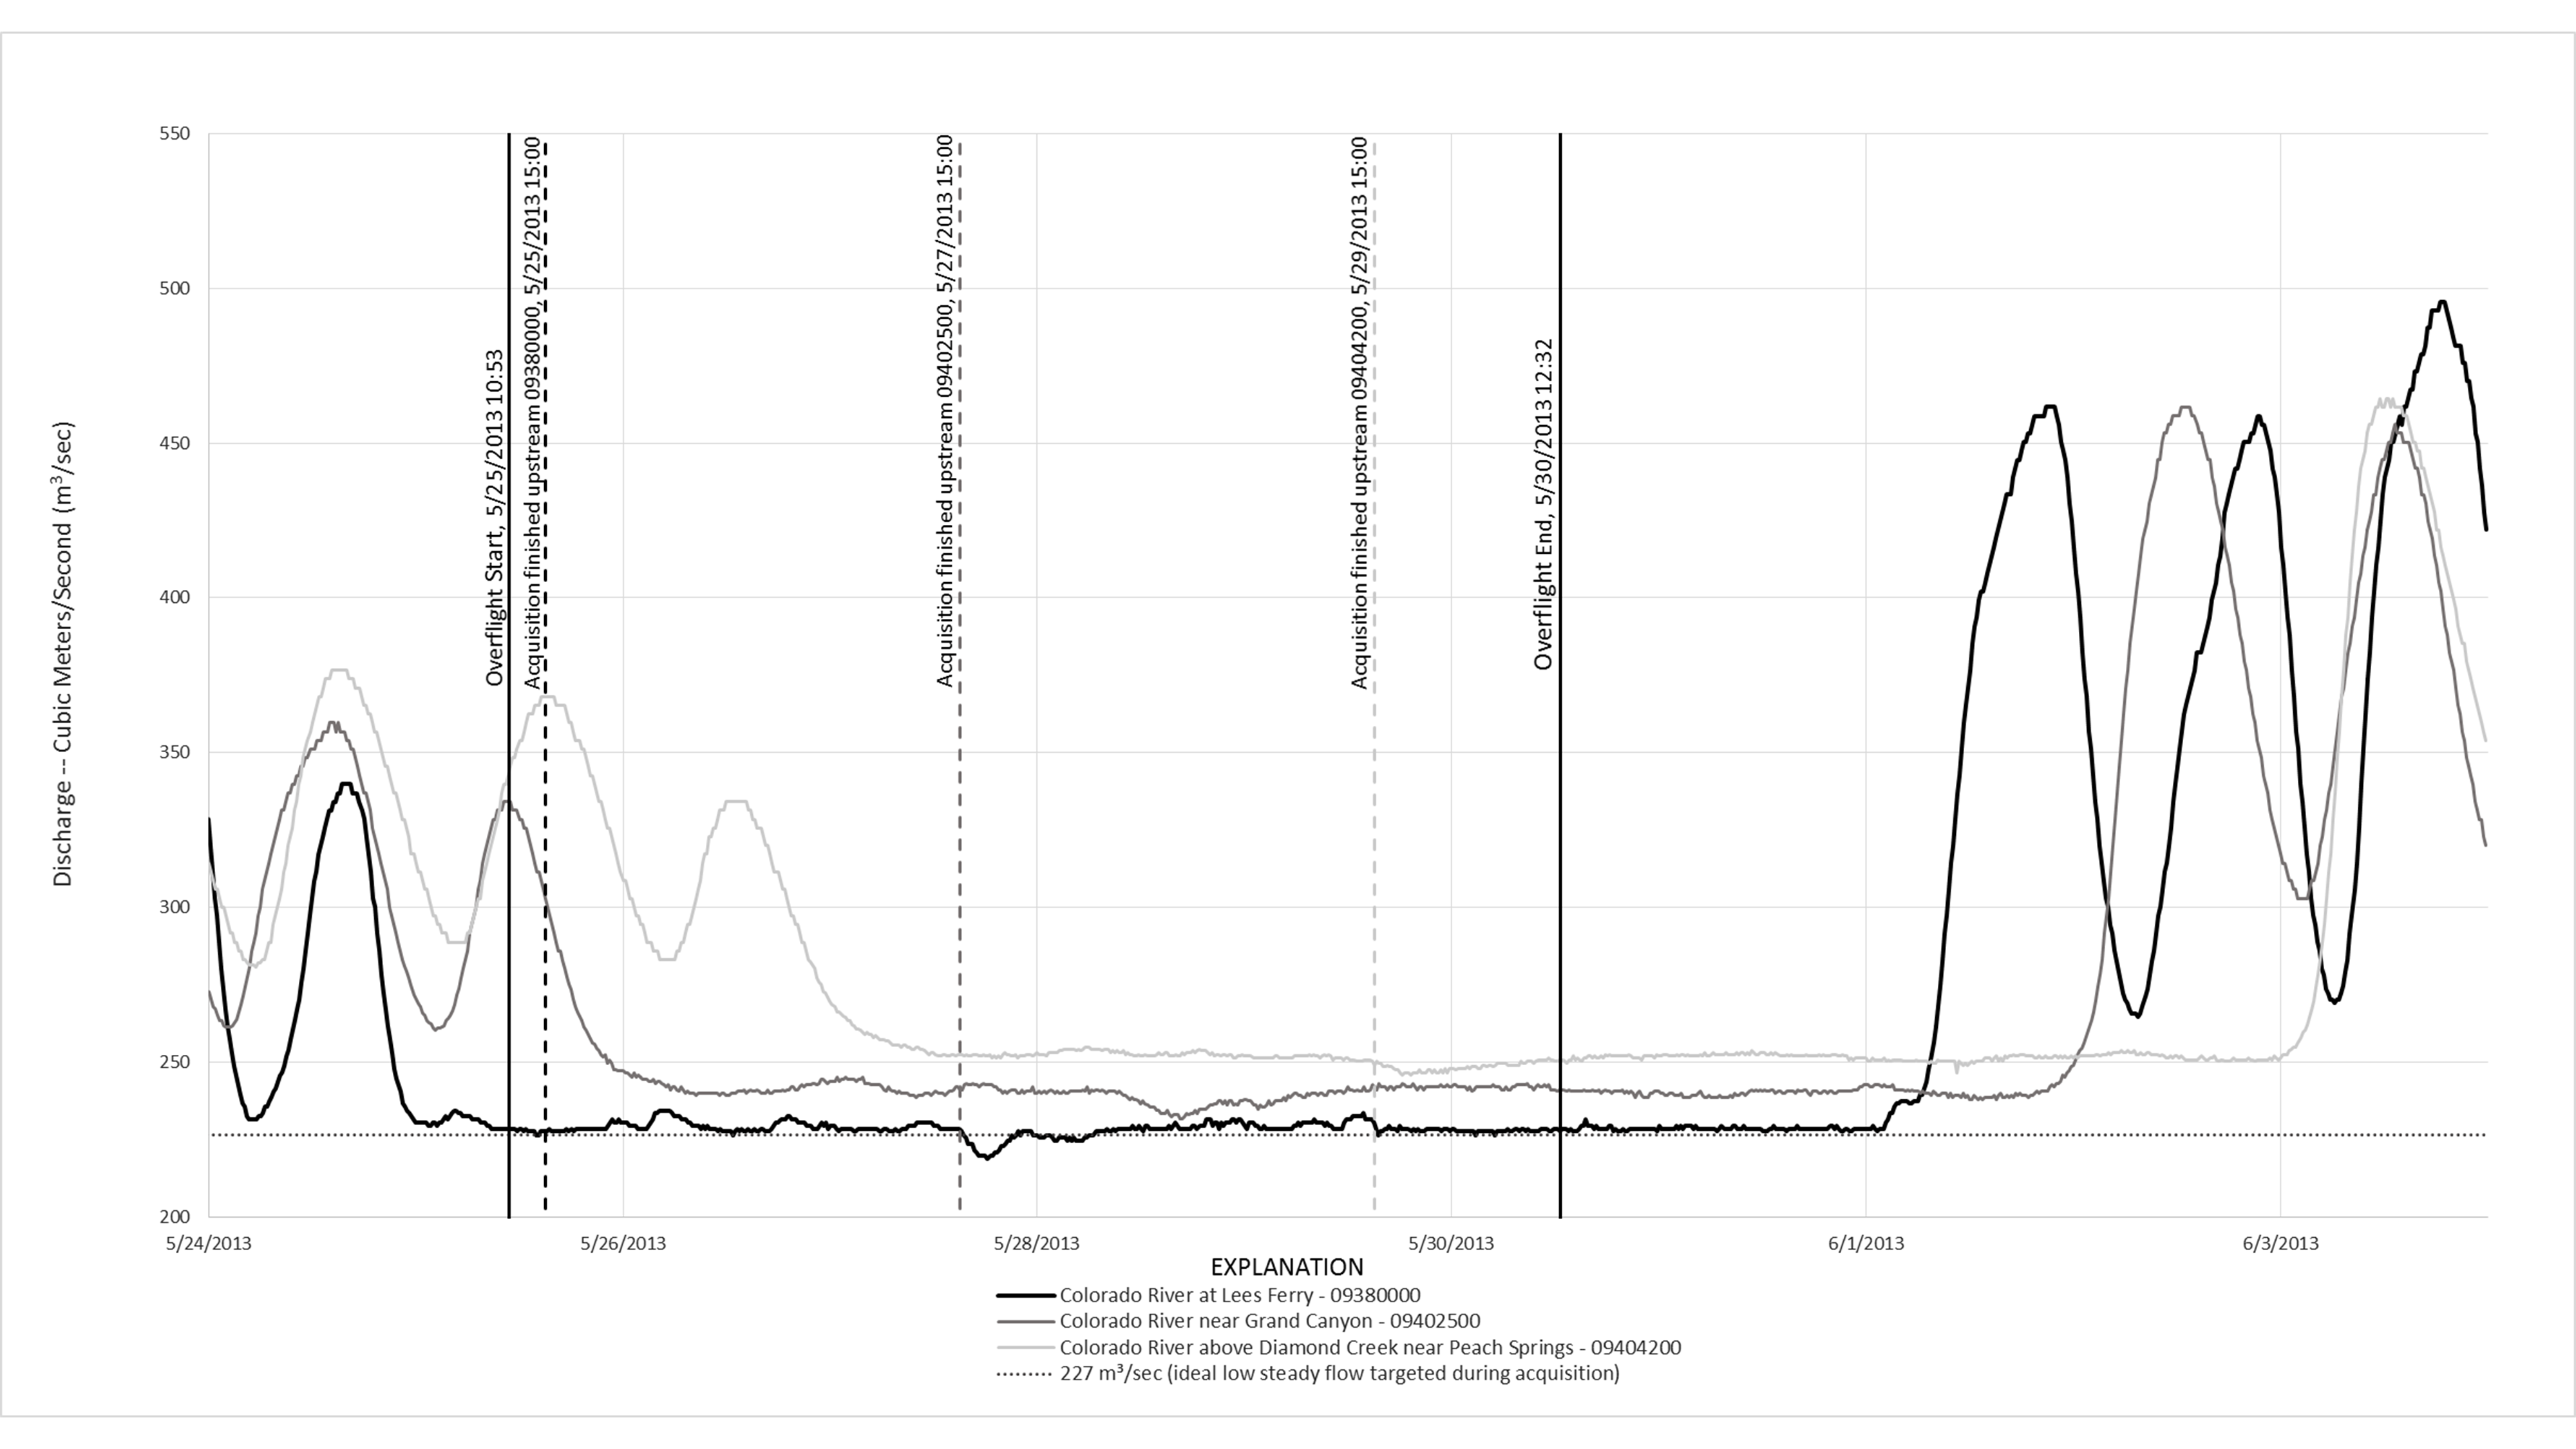 Figure 2. Colorado River hydrograph at three streamgage locations: Colorado River at Lees Ferry (0 kilometer [km], though 24 km downstream from Glen Canyon Dam), Colorado River near Grand Canyon (142 km), and Colorado River above Diamond Creek Near Peach Springs (363 km). Note variation in discharge along river corridor during flight-mission image-acquisition period, owing to inherent variation in targeted dam release of about 227 m3/s during mission, as well as influences of tributary flows. Table 1. 2013 overflight wave-tracking schedule for the targeted low steady dam release of 227 cubic meters per second (m3/s).
[km, kilometer]
|

![]() U.S. Department of the Interior |
U.S. Geological Survey
U.S. Department of the Interior |
U.S. Geological Survey
URL: http://pubsdata.usgs.gov/pubs/ds/1027/ds1027_data_collection.html
Page Contact Information: GS Pubs Web Contact
Page Last Modified: Monday, 12-Dec-2016 18:49:05 EST
