USGS - science for a changing world

Data Series 1031

Archive of Bathymetry Data Collected in South Florida From 1995 to 2015

Skip Links

Project Description - Shark River and Trout Creek (2004)


Figure 32. Project study area - Shark River and Trout Creek, Florida. [Click on icon for link to data page]

During the past century, river and tidal creeks throughout the coastal wetlands of the Everglades have filled with sediment and vegetation from surrounding landscapes to the point that many have greatly diminished or disappeared entirely. Restoration plans are under consideration to redirect additional freshwater inflow from the Everglades to open and sustain these waterways to a level that closely resembles historical patterns.

The South Florida Water Management District (SFWMD) has developed hydrodynamic numerical models to help define the restoration plan and oversees monitoring of the restoration efforts to assess the impacts.

This study had two objectives:

  • Establishing protocols for channel-characteristic mapping that will provide adequate, consistent information about different channels, and changes in channels, through time that can be used in the Everglades processes modeling. Hydrodynamic models require high-resolution boundary conditions to produce accurate results.
  • Evaluating the accuracy and cost of various techniques for assessing changes in geomorphic features of tidal rivers and creeks along the coastal ecotone of the southern Everglades for restoration impact monitoring. These surveys will characterize the longitudinal gradient and cross-profiles of the tidal river networks.

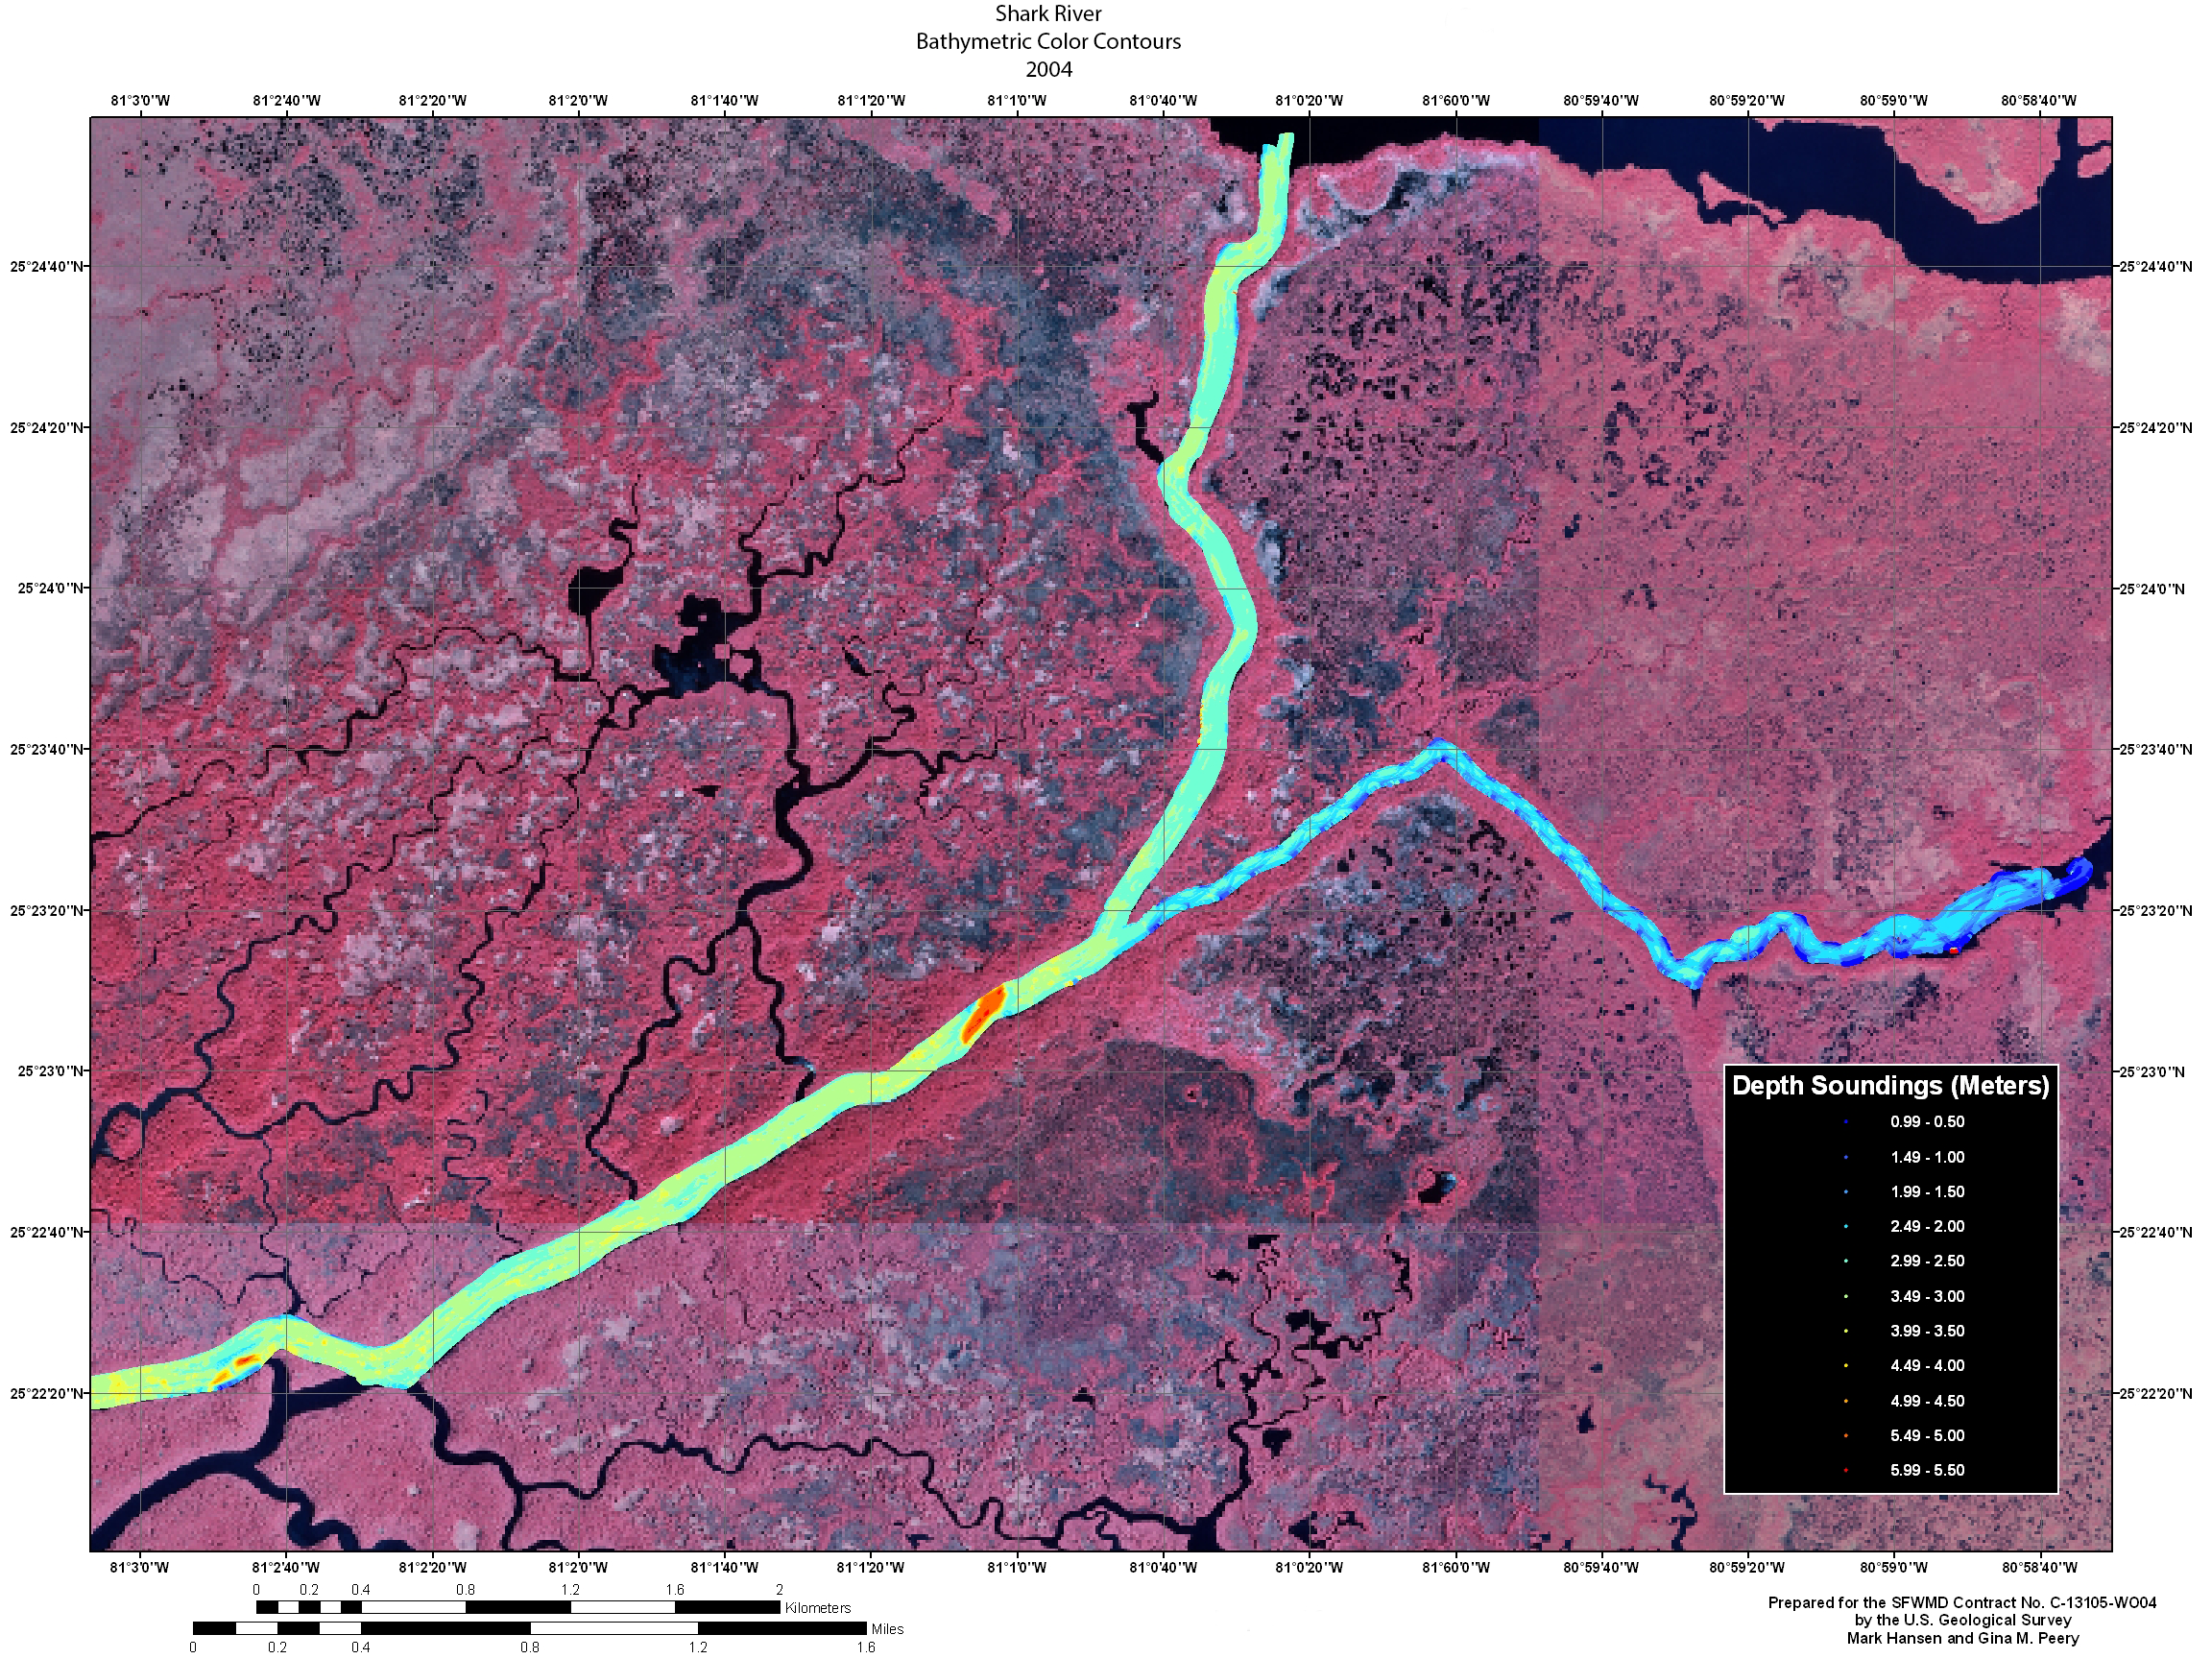
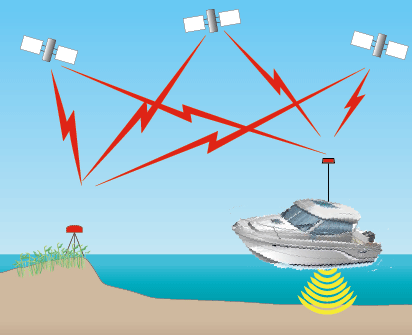
SFWMD requested that the U.S. Geological Survey USGS develop a strategy for defining mapping protocols appropriate for tidal rivers and creeks located in south Florida. Shark River (Gulf of Mexico side) and Trout Creek (Florida Bay side) were identified as representative study sites for this project (fig. 32). Field tests were conducted to evaluate mapping protocols for their accuracy, precision, and cost effectiveness. Two boat-based acoustic techniques were assessed: single-beam and interferometric swath systems. Figure 33 is a color-coded example bathymetry map of the Shark River produced from data acquired with the interferometric swath system.

Example of swath data collected in the Shark River, Florida

Figure 33. Example of swath data collected in the Shark River, Florida. [Click to enlarge]

SURVEY HIGHLIGHTS


  • Area of Coverage The Shark River from the mouth on the Gulf of Mexico inland approximately 17 kilometers (km) to Tarpon Bay. All of Trout Creek was surveyed. Water depths ranged from 0.3 to 5.0 meters (m).
  • Survey Date Survey data were collected in January 2004.
  • Data and Formats X,Y,Z soundings. Number of soundings: single-beam 23,407; swath 2,226,397. Comma-delimited text and ESRI point shapefile formats. Due to file size, the swath data are divided by USGS quadrangle boundaries.
  • Survey Control All data were processed relative to the WGS84(G1150) ellipsoid. In order to maintain the 15 km guideline, two new monuments were established within the Shark River and Trout Creek regions, each being occupied with multiple long-duration (8 hours or greater) sessions. Coordinates of the control locations are listed here. The methodology for establishing new control locations is described in Establishing New Control using GIPSY, SCOUT and OPUS.
  • Accuracy Precise differential GPS was used to determine horizontal and vertical positions. The estimated horizontal and vertical accuracy of the single-beam soundings is approximately 6 centimeters (cm) and 8 cm, respectively, and approximately 15 cm and 20 cm for swath soundings.

(back to top)

Accessibility FOIA Privacy Policies and Notices

Take Pride in America logo USA.gov logo U.S. Department of the Interior | U.S. Geological Survey
URL: http://pubsdata.usgs.gov/pubs/ds/1031/ds1031_sharktrout_description.html
Page Contact Information: GS Pubs Web Contact
Page Last Modified: Monday, 24-Jul-2017 11:45:20 EDT