


Project Description - Tampa Bay (2001-2004)
|
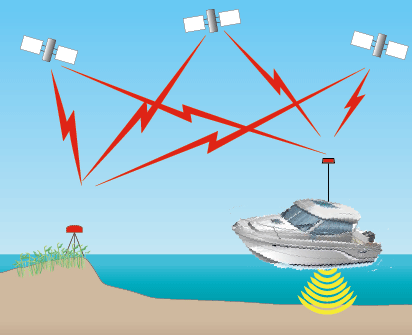
Figure 17. Project study area - Tampa Bay, Florida. [Click on icon for link to data page] Tampa Bay (fig. 17) and its surrounding area have experienced phenomenal urban growth and significant changes in land-use practices over the past 50 years. This trend is expected to continue, with human activity intensifying and affecting a wider geographic region. Urbanization has created impervious surfaces, which increase stormwater runoff and contribute to higher levels of chemicals, such as pesticides and fertilizers, flowing into the area’s waters. These chemicals have contributed to declines of seagrasses and other marine life. A major focus of the USGS Coastal and Marine Geology Program (CMGP) Tampa Bay Study was to investigate sediments and their associated contaminants, and to develop a bay-wide circulation model to determine the routes of sediment transport. Before models could be accurately applied, updated sea floor elevation data were needed for the entire bay. Baseline maps provide the physical context, background and reference information for other project research, monitoring, and modeling activities. Sea floor elevation mapping provides critical information for development of circulation, hydrologic, sediment transport, water quality, and urbanization integrated modeling. High-resolution, sea floor mapping was conducted in Tampa Bay between 2001 and 2004 as part of the CMGP Tampa Bay Study (fig. 18). High-resolution, acoustic bathymetric surveying is a proven method of mapping bay and estuary elevations. Data were collected throughout the entire bay including all small, peripheral embayments and channels.
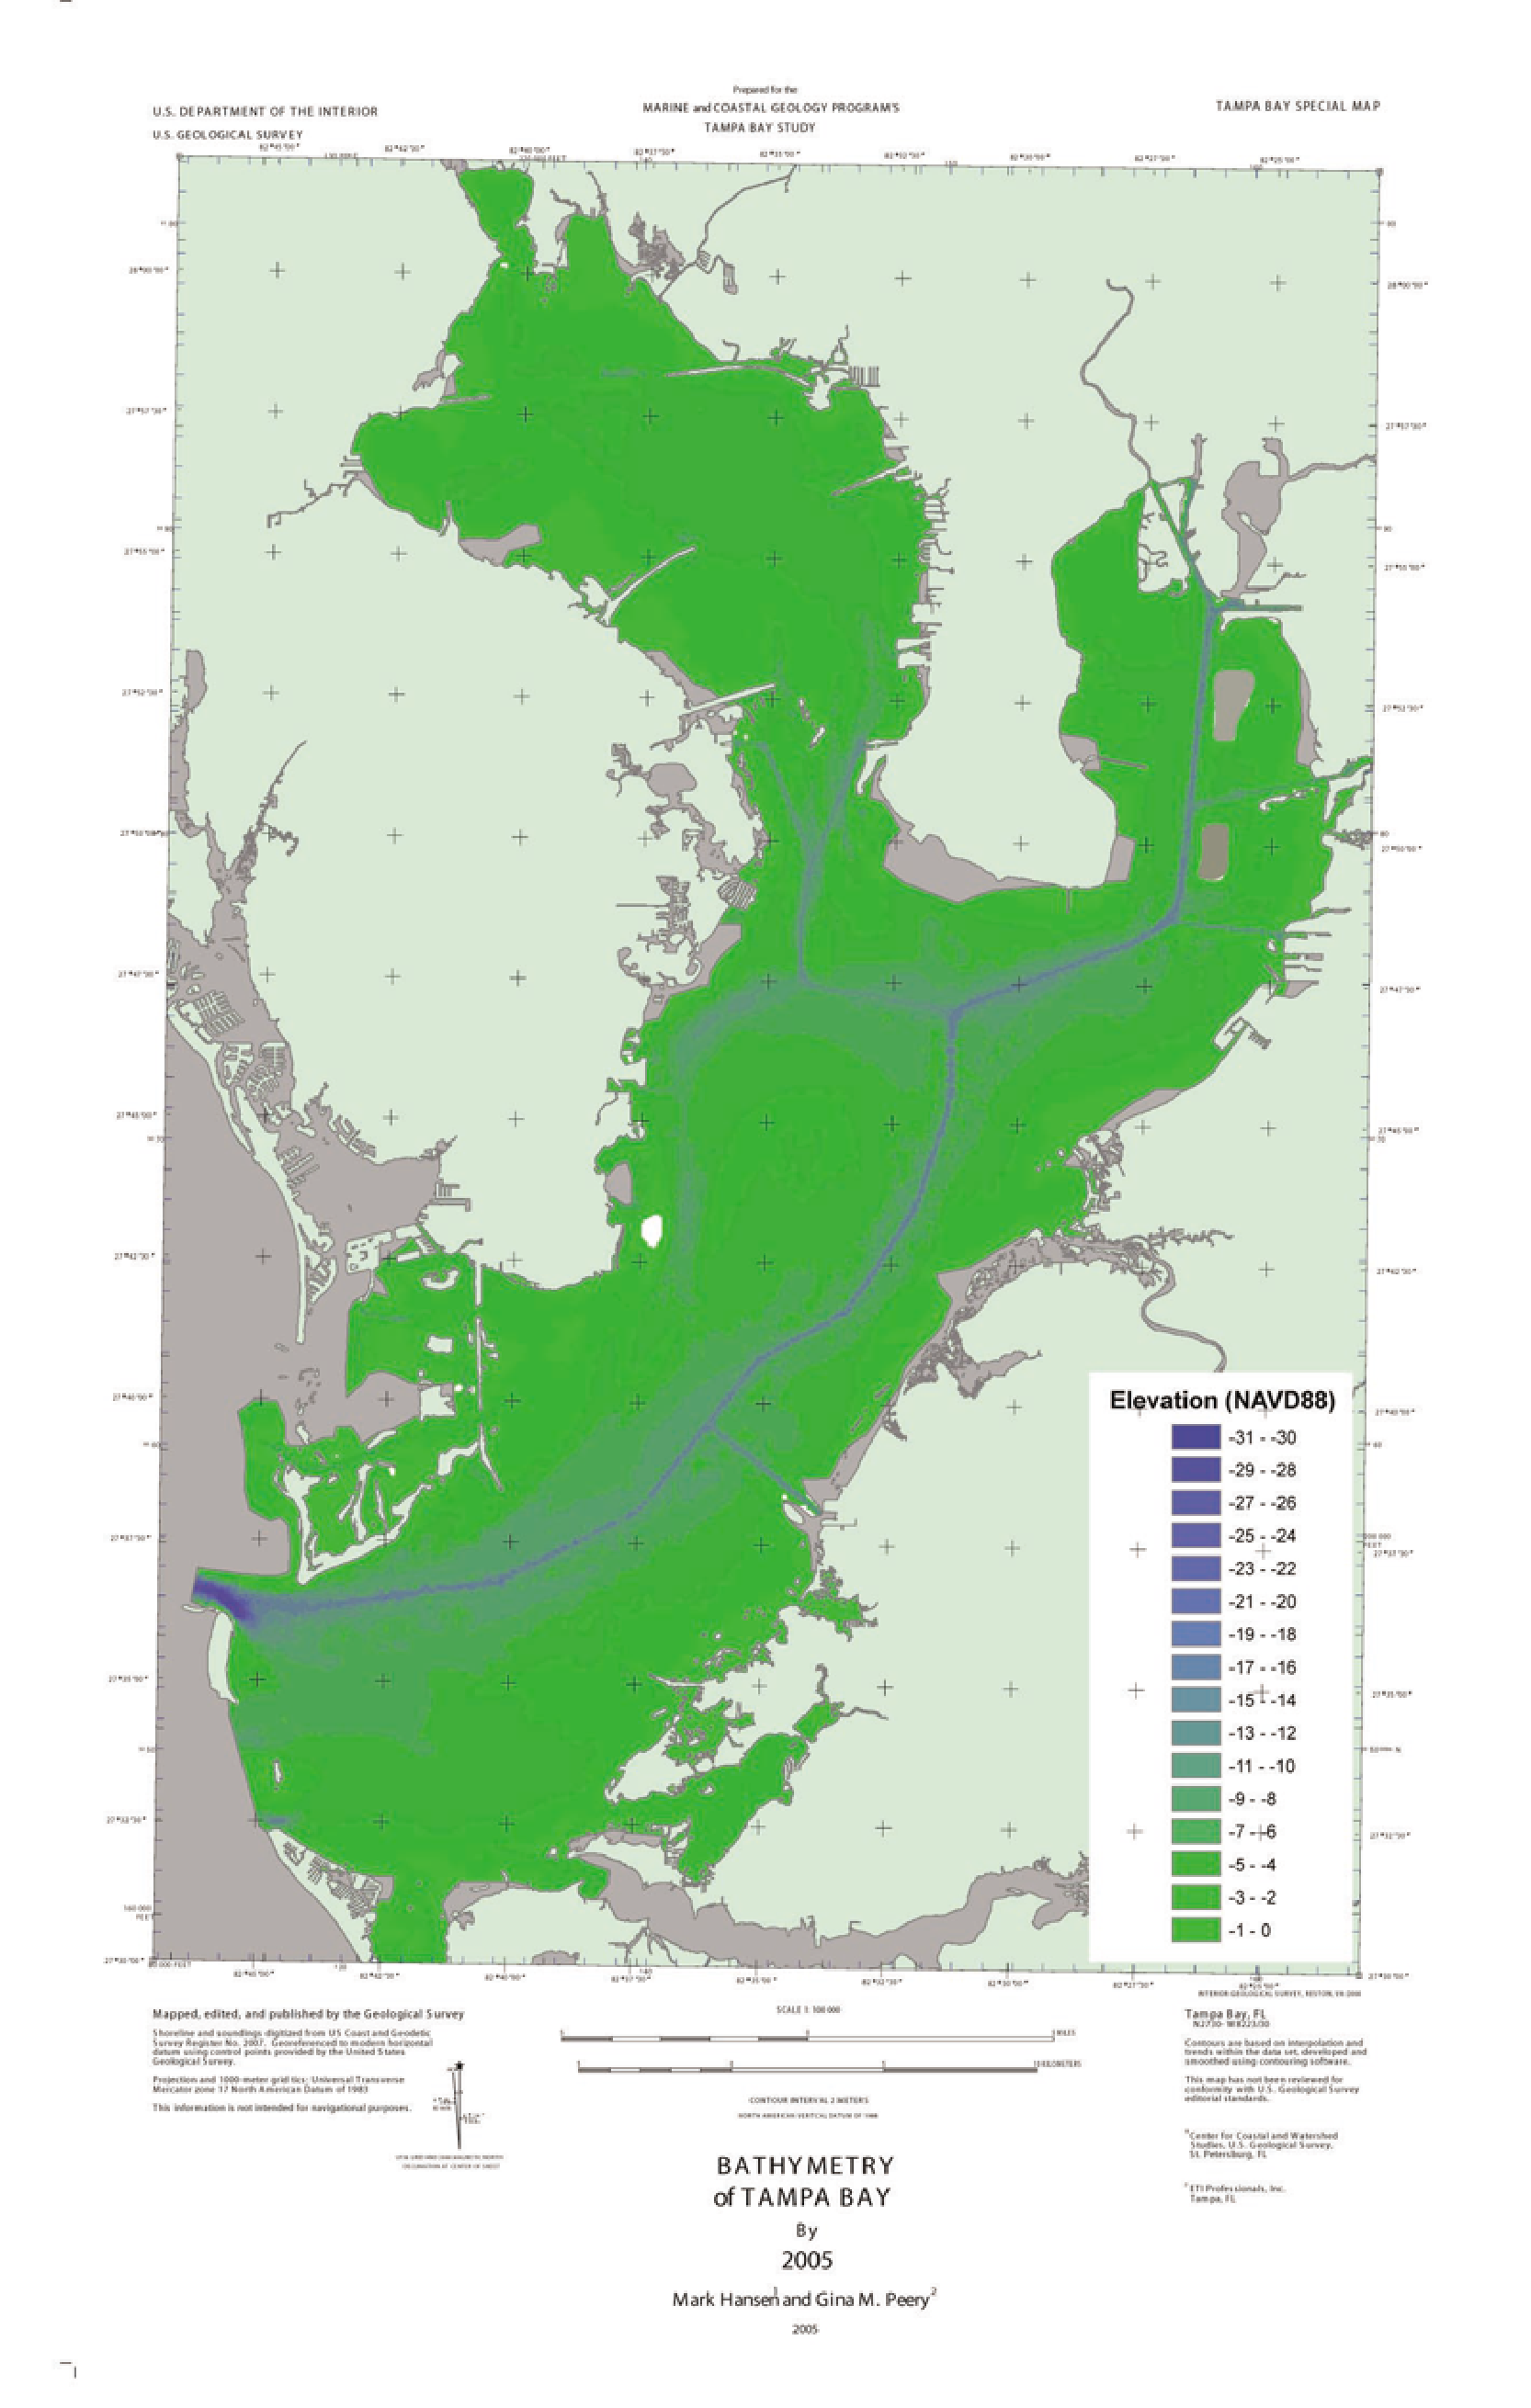
Figure 18. Bathymetric map of Tampa Bay, Florida (2005). [Click to enlarge] |
SURVEY HIGHLIGHTS
|