Data Series 1041
| Data ProcessingNavigationThe coordinate for each of the GPS base stations (PAF1, PAF2, PAF3) are the time-weighted average of values obtained from the National Geodetic Survey's (NGS) On-Line Positioning User Service (OPUS). All base station sessions were decimated to 30 s and then submitted to OPUS via the online service. All OPUS solutions were entered into a spreadsheet, and ellipsoid value for each station were calculated for the duration of the occupation. Any processed GPS session in which the average ellipsoid value was greater than three standard deviations (s) from the time-weighted mean were excluded from the final coordinate calculations. The final base station coordinates were imported into GrafNav software version 8.5 (Waypoint Product Group) and the kinematic GPS data from the survey vessel were post-processed to the concurrent static GPS data from the nearest base station to minimize vertical error. The final differentially-corrected precise positions were computed at intervals of 0.1 or 0.2 s depending upon the rover acquisition setting and then were exported in American Standard Code for Information Interchange (ASCII) text format. These positions replaced the uncorrected, real-time rover positions recorded during acquisition during subsequent processing. The processed GPS data were exported in the World Geodetic System of 1984 (WGS84) (G1150) geodetic datum, Universal Transverse Mercator (UTM) zone 15 North (15N). Soundings and MotionThe raw HYPACK data files were imported into CARIS Hydrographic Information Processing System (HIPS) and Sonar Information Processing System (SIPS) software, version 9.0.17. All bathymetric data components (position, motion, depth, GPS tide, and speed of sound) were applied, merged, and geometrically corrected in CARIS to produce processed x,y,z point data. Erroneous (horizontally or vertically offset) point data likely result from (1) cavitation in the water column obscuring the fathometer signal, (2) tight turns in the surf zone affecting the tracking of the incoming GPS signal, and/or (3) false readings due to general equipment issues. All point data found to be inaccurate were either discarded or adjusted. Data points in areas of extremely shallow water (0.30 to 0.50 m) such as those on shoals or within seagrass beds were additionally reviewed against the surrounding data for overall consistency. The corrected point data were exported as an x,y,z ASCII text file referenced to WGS84 (G1150), UTM zone 15N, with ellipsoid height in meters. The merged single-beam bathymetry datasets combined (15BIM05, 15BIM06, 15BIM07, 15BIM08) consist of 4,626,459 point elevations with an ellipsoidal elevation range of -36.531 to -27.419 m. Error AnalysisSingle beam data were imported into Esri ArcMap version 10.2, where a shapefile of the individual data points (x,y,z) was created and plotted in 0.5-m color-coded intervals for further quality assurance and quality control (QA/QC) analysis. A Python script was used to evaluate elevation differences at the intersection of crossing tracklines. The script calculates the elevation difference between points at each intersection using an inverse distance weighting equation. If discrepancies were found, the line in error was statically adjusted only by the average of the crossings within the line, or the line in error was removed. There were a total of 676 crossings for the survey, 76 percent of which were less than or equal to 0.15 m offset. Digital Elevation ModelThe final sounding data that contribute to the Digital Elevation Model (DEM) were transformed horizontally into North American Datum of 1983 (NAD83) (CORS96), UTM zone 15N, and vertically into the North American Vertical Datum of 1988 (NAVD88) orthometric height, using the GEOID12A geoid model and the National Oceanic and Atmospheric Association (NOAA) VDatum version 3.2 transformation software (reported vertical transformation error is 5.4 cm). The resulting orthometric heights (elevations) for all survey vessels ranged from -0.20 to -9.36 m. The NAVD 88 point elevations were imported into ESRI’s ArcMap version 10.2 and gridded using the 3D Analyst and Spatial Analyst toolsets. A triangulated irregular network (TIN) was created from the shapefile containing the final point data using the "Create TIN" tool, and the data were then converted into a digital elevation model (DEM) using the "TIN to Raster” tool and natural neighbors algorithm with a cell size of 200 m. A bounding polygon representing the extent of survey tracklines was created and converted into a raster mask using the ArcGIS "Polygon to Raster" tool, and the interpolated DEM was clipped to this survey extent using the "Extract by Mask" tool. The final product is a DEM of the entire survey extent with elevation range from -0.40 m maximum to -7.25 m minimum for full data representation (fig. 7). 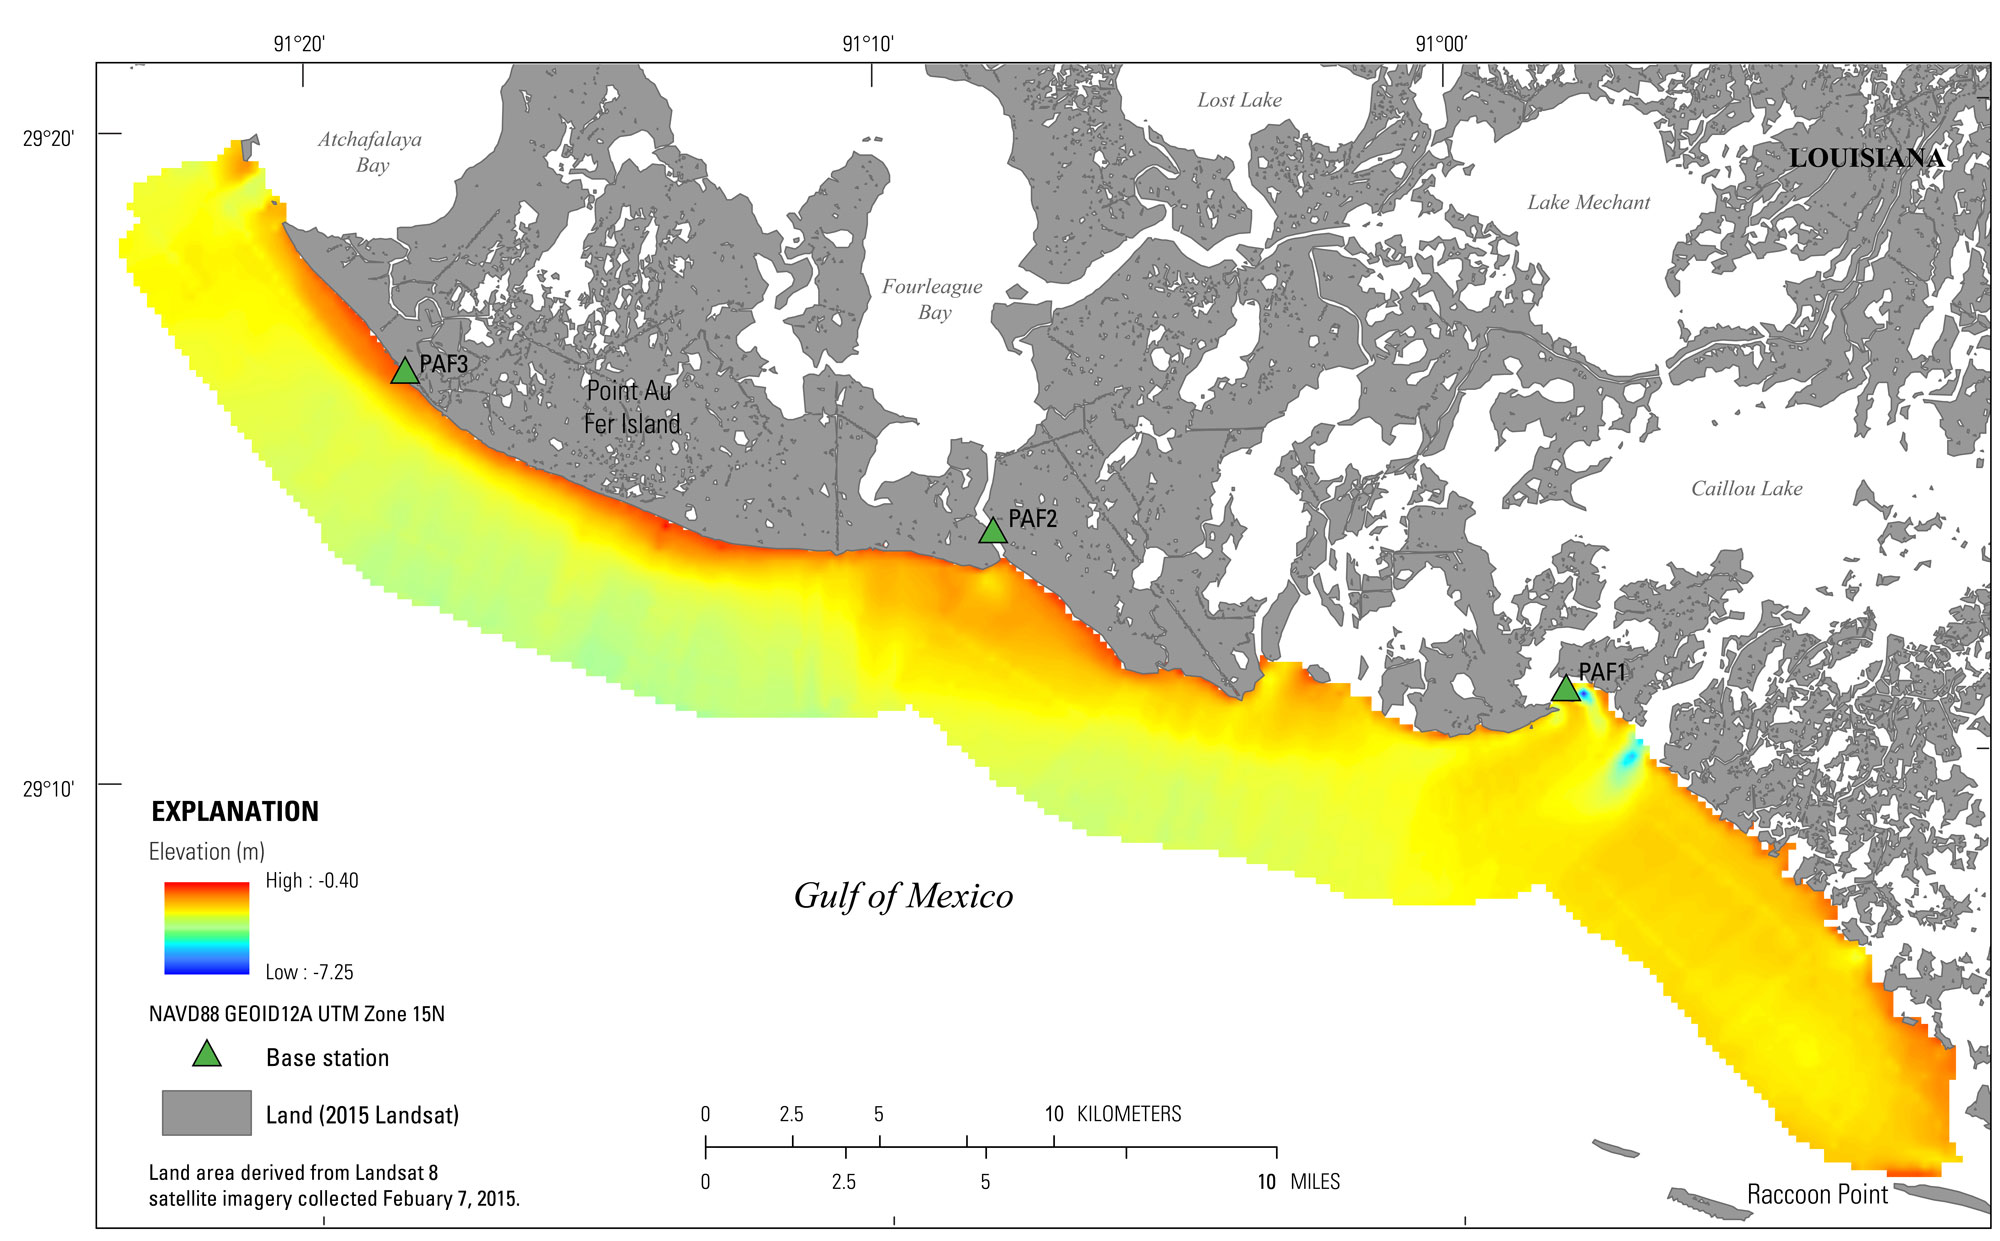 Figure 7. The final 200-meter (m) Digital Elevation Model (DEM) for the 2015 Point Au Fer, Louisiana, single-beam bathymetry survey. Horizontal data is referenced to the North American Vertical Datum of 1983 (NAD83), UTM zone 15 North, and the vertical data is referenced to the North American Vertical Datum 1988 (NAVD88) with respect to GEOID12A. [Click figure to enlarge] |

![]() U.S. Department of the Interior |
U.S. Geological Survey
U.S. Department of the Interior |
U.S. Geological Survey
URL: http://pubsdata.usgs.gov/pubs/ds/1041/ds1041_data-processing.html
Page Contact Information: GS Pubs Web Contact
Page Last Modified: Thursday, 09-Mar-2017 09:15:13 EST
