Data Series 1046
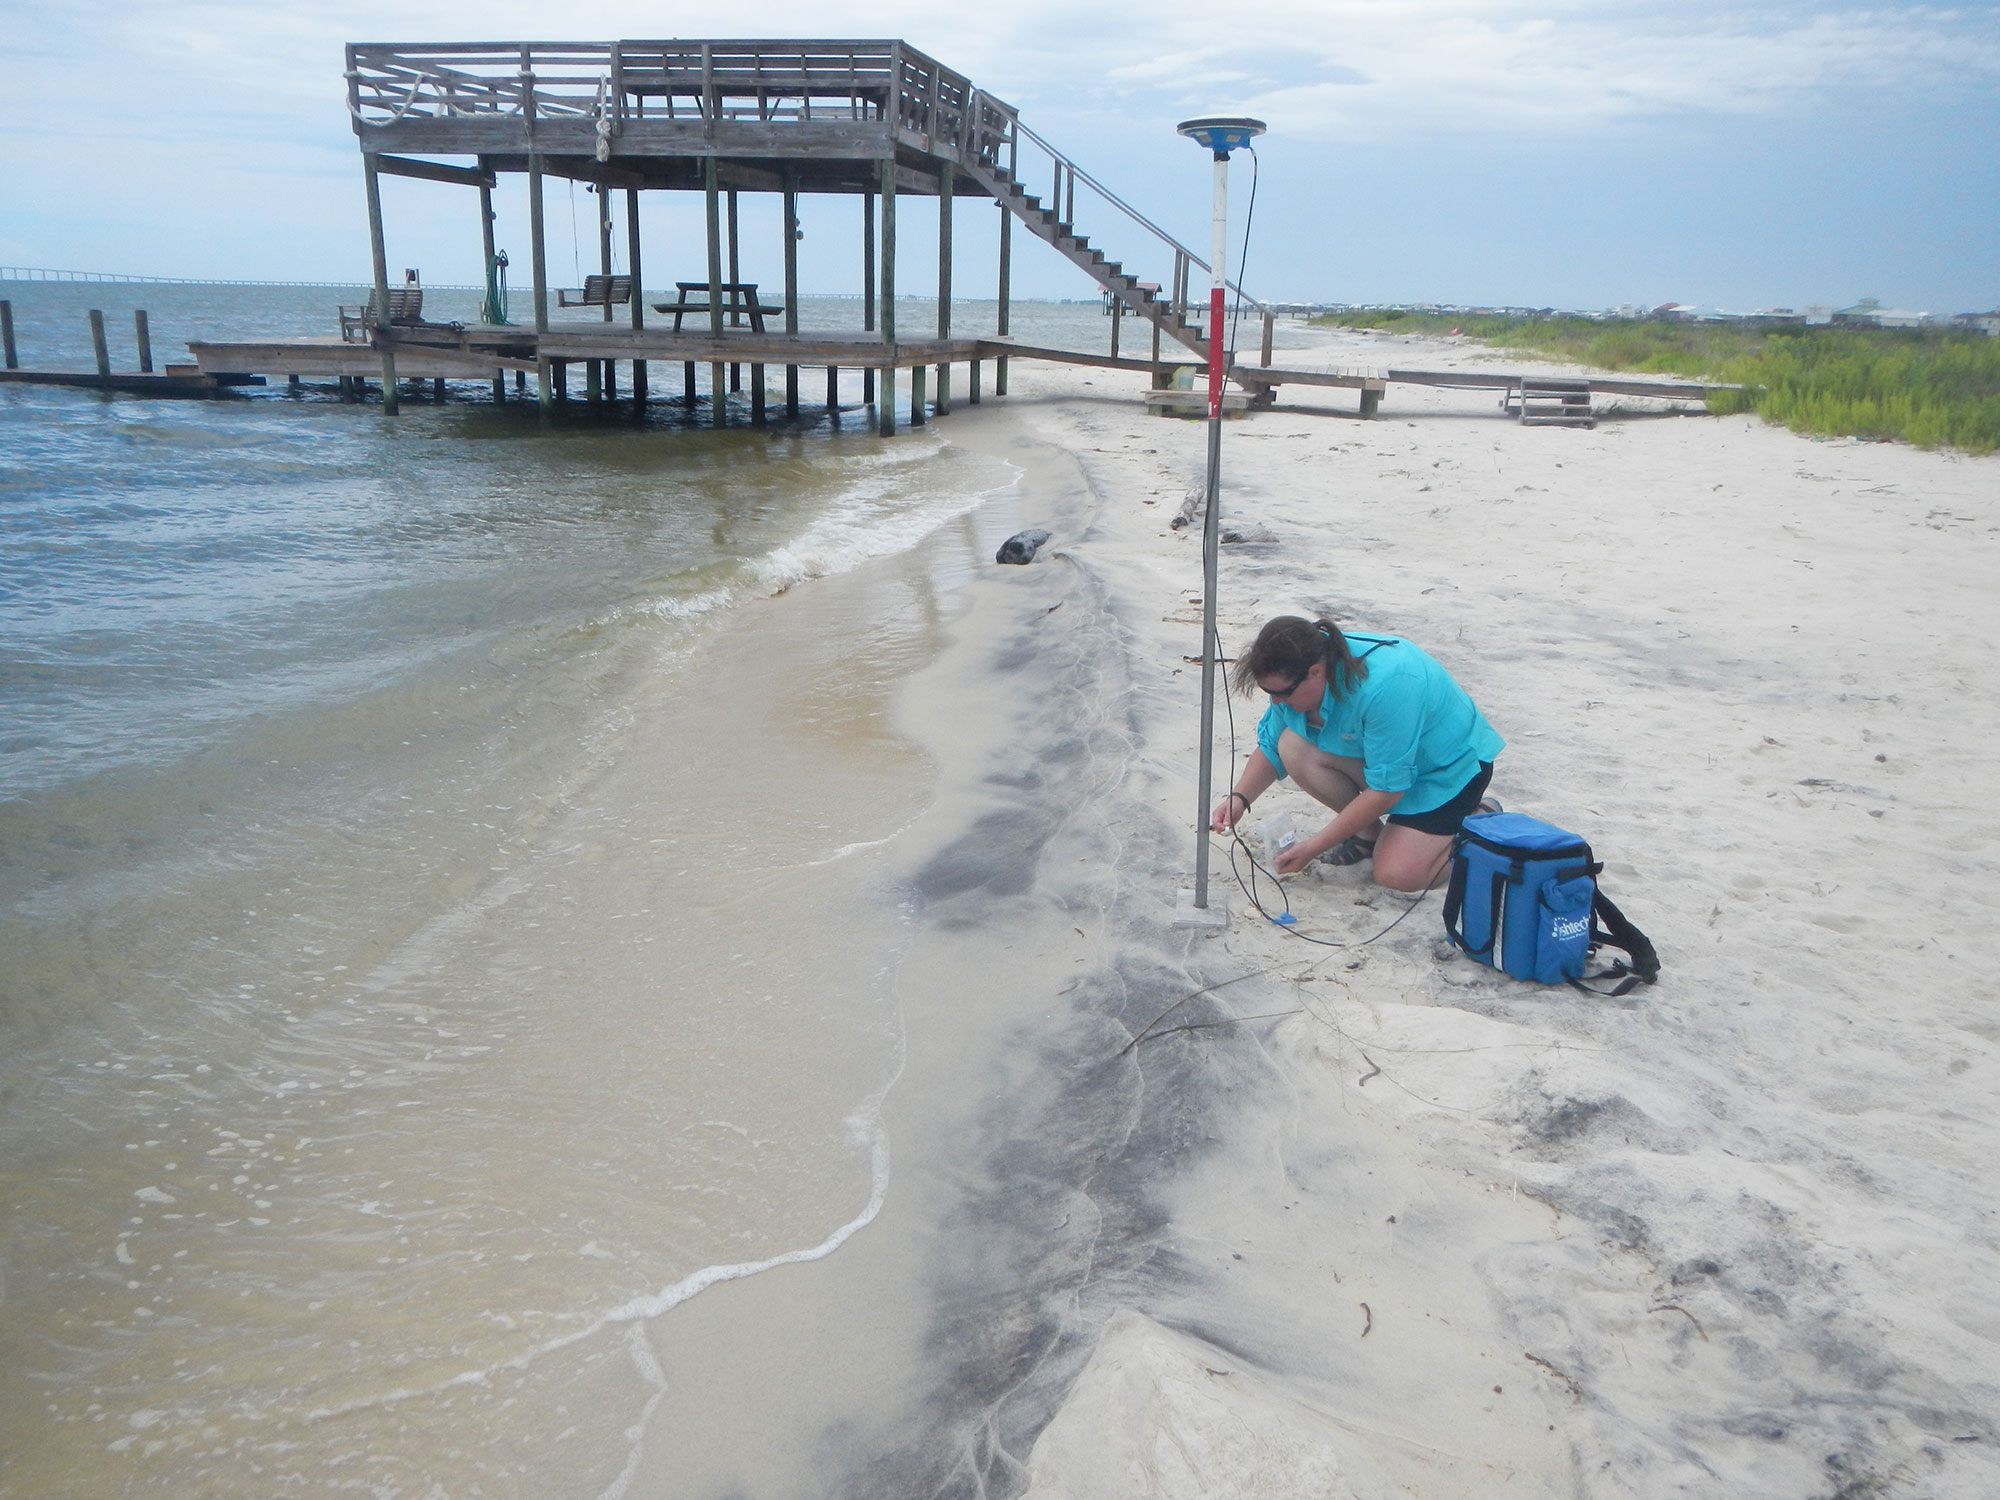
| Field Data CollectionIn August 2015, scientists from the USGS conducted field work on and around Dauphin Island, Alabama, from August 12 through August 20 (USGS Field Activity Number (FAN) 2015-322-FA, 15BIM09). Aerial imagery, bathymetry data, lidar, and the Offshore Alabama Sand Information System (OASIS; Jones and others, 2009) were used to develop a sampling scheme whose primary goal was to include a variety of habitats both on and off of the island and in areas more and less affected by storm events. The second goal of the sampling scheme was to maximize coverage of the island and the surrounding areas in order to detect and understand the natural textural variations of the terrain (fig. 2). During field work, grab samples —indicated by the letter “G” at the end of the sample identification (ID) number—were collected by two research vessels (R/V); one used a petite Ponar and the other used a miniature Sea Bed Observation and Sampling System (miniSEABOSS; Blackwood and others, 2000) equipped with a VanVeen sediment sampler, video cameras, lights, and a hand-held Castaway-CTD (fig. 3). At each site, 20–30 milliliters (mL) of the top 1 centimeter (cm) of the surface sediment was collected for sediment characterization including grain-size, bulk density, water content, loss on ignition (LOI), stable isotopes δ13C and δ15N, bulk carbon and nitrogen concentrations, and bulk metal concentrations. At select sites, additional material was collected for micropaleontology (15–20 mL), organic biomarkers, and archive (10 mL). During the same period, surface samples were collected on land from salt marsh, washover deposits, beach, and dune sites—indicated by an “S” at the end of the sample identification number—by carefully removing the top 1 cm of the surface sediment from the land (fig. 4). Marsh push cores and peat auger cores were collected to evaluate the long and short-term changes to the marshes surrounding Dauphin Island; those data can be found in a separate publication. At all sites, coordinates were obtained using either a commercially available hand-held Global Positioning System (GPS) or boat-mounted chart plotter. Sites occupied by the R/V Sallenger, which was equipped with the miniSEABOSS, had water-quality parameters recorded for the entire water column, including bottom water, by use of the handheld Castaway–CTD; sites occupied by the R/V Mako recorded water-quality information with a Castaway–CTD and a YSI Professional Plus at 1 meter (m) below the water surface. Water-quality parameters collected by the YSI meter include salinity, pH, temperature, dissolved oxygen (DO), specific conductance, and oxidation-reduction potential (ORP). Parameters collected by the Castaway–CTD include cast time, latitude, longitude, horizontal and vertical error, pressure, depth, temperature, conductivity, specific conductance, salinity, sound velocity, and density. YSI and Castaway–CTD water-quality data are available on the data downloads page. Water depth was also recorded at each sample site by a depth sounder or direct measurement at the time of collection. No corrections were made to the dataset to compensate for fluctuating tidal stages. PositioningLatitude, longitude, and elevation data for each land surface site were recorded using a differential GPS (DGPS) and were constrained by post-processed differential corrections using a base station-to-rover setup. Field setup consisted of a rover GPS unit used to collect data at each sample site and two base stations. Base stations were established approximately 11 kilometers (km) apart to ensure coverage across the island. Each base station consisted of a Thales choke-ring antenna, tripod, and an Ashtech Z-Xtreme receiver sampling at 1 hertz (Hz). The first base station was located at a National Geodetic Survey (NGS) published reference point, permanent identification number (PID#) BH1755 (Station ID: 8735180), located on the eastern side of the island. The second base station was set up on a study specific benchmark established on the western side of the island within the city public access parking lot during the sampling trip and is referred to as Dauphin Island West End (DIWE). The rover unit used a configuration similar to the base configurations: an Ashtech Z-Xtreme receiver and geodetic antenna. Rover antenna height from the ground was measured and recorded at each site, and each site was occupied for a minimum of 30 minutes.  Figure 2. Map showing the location of all surface sediment samples collected on and around Dauphin Island, Alabama, during the August 2015 sampling trip. Click on the colored box outlines for a magnified view of the sampling areas. All sites are labeled with the sample number followed by either the letter S (signifying a land surface site) or G (signifying a grab site) to indicate sample type as defined in this section of the report. Some sample types do not match the imagery because of the dynamic nature of the island and the imagery set used. [Click to Enlarge] PositioningLatitude, longitude, and elevation data for each land surface site were recorded using a differential GPS (DGPS) and were constrained by post-processed differential corrections using a base station-to-rover setup. Field setup consisted of a rover GPS unit used to collect data at each sample site and two base stations. Base stations were established approximately 11 kilometers (km) apart to ensure coverage across the island. Each base station consisted of a Thales choke-ring antenna, tripod, and an Ashtech Z-Xtreme receiver sampling at 1 hertz (Hz). The first base station was located at a National Geodetic Survey (NGS) published reference point, permanent identification number (PID#) BH1755 (Station ID: 8735180), located on the eastern side of the island. The second base station was set up on a study specific benchmark established on the western side of the island within the city public access parking lot during the sampling trip and is referred to as Dauphin Island West End (DIWE). The rover unit used a configuration similar to the base configurations: an Ashtech Z-Xtreme receiver and geodetic antenna. Rover antenna height from the ground was measured and recorded at each site, and each site was occupied for a minimum of 30 minutes.
|

![]() U.S. Department of the Interior |
U.S. Geological Survey
U.S. Department of the Interior |
U.S. Geological Survey
URL: http://pubsdata.usgs.gov/pubs/ds/1046/ds1046_data-collection.html
Page Contact Information: GS Pubs Web Contact
Page Last Modified: Wednesday, 07-Jun-2017 11:47:58 EDT