Data Series 1046
| Laboratory Methods and Data ProcessingPositioningBase station data were postprocessed through the NGS Online Positioning User Service (OPUS), and time-weighted average positions were calculated. The time-weighted average elevations calculated from the base station data were 0.008 meters (m) lower than the published NGS control elevation listed for BH1755, which is within the error value tolerances calculated for the base station. The error associated with base station data BH1755 is ± 0.015 m and ± 0.011 m for DIWE. Base station coordinates were imported into GrafNav, version 8.5 (NovAtel Waypoint Product Group), and the data from the rover GPS were postprocessed to the concurrent GPS session data to the nearest base station. The position and elevation data were then exported as a text file. The processed navigation data can be downloaded from the data downloads page. Physical Sediment ParametersIn the laboratory, samples were homogenized in the sample bag, and the subsample for sediment parameters was extracted and processed for basic sediment characteristics: dry bulk density and porosity. Water content, porosity, and dry bulk density were calculated by determining the water mass lost during drying. Known volumes of each wet subsample, usually 30-60 mL, were packed into a graduated syringe with 0.5 cubic centimeter (cm3) resolution. The wet sediment was then extruded into a preweighed aluminum tray, and the wet sediment's weight was recorded. The wet sediment and tray were placed in a drying oven for 48 hours at 60 °C. Water content (θ) was determined as the mass of water (lost when dried) relative to the initial wet sediment mass. Porosity (φ) was estimated with the following equation 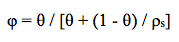
where ρs is sediment density which is assumed to be 2.5 grams per cubic centimeter (g/cm3). Salt-mass contributions were removed based on the salinity measured at the time of sample collection. If salinity was not measured in the field, pore water salinity was estimated to be 30.75 for G sites and 25.89 for S sites, which are the average salinity values for the site types in this study. Organic matter (OM) content was determined with a mass loss technique (LOI). The dry sediment from the previous process was homogenized with a porcelain mortar and pestle. Approximately 5 grams (g) of the dry sediment was placed into a preweighed porcelain crucible. The mass of the dried sediment was recorded with a precision of 0.01 g on an analytical balance. The sample was then placed inside a laboratory muffle furnace with stabilizing temperature control. The furnace was heated to 110 °C for a minimum of 6 hours to remove hygroscopic water adsorbed onto the sediment particles. The furnace temperature was then lowered to 60 °C, at which point the sediment samples could be reweighed. The dried sediment was returned to the muffle furnace. The furnace was heated to 550 °C over a period of 30 minutes and kept at 550 °C for 6 hours. The furnace temperature was then lowered to 60 °C, at which point the sediment samples could be reweighed. The mass lost during the 6-hour baking period, relative to the 110 °C-dried mass, is used as a metric of organic matter content (modified from Dean, 1974). Approximately 16 percent of the field samples were run in duplicate for LOI to assess precision. The physical parameter data for each surface sample are included in this report's data downloads. Grain-Size AnalysisGrain-size analyses on the surface samples were performed using a Coulter LS 13 320 (beckmancoulter.com) particle size analyzer, which uses laser diffraction to measure the size distribution of sediments ranging in size from clay (0.4 micrometers (µm)) to very coarse-grained sand (2 millimeters (mm)). Of the 303 surface samples collected, 7 were not analyzed due to an abundance of oyster shells. Prior to particle size analysis, sediment samples that appeared to consist of greater than 5 percent organic material were digested with 8 mL of 30 percent hydrogen peroxide (H2O2) overnight to remove excess organics. The H2O2 was then evaporated slowly on a hot plate, and the sediment was washed and centrifuged twice with deionized water. Samples that appeared to consist of less than 5 percent organic material were dried at 60 °C. To prevent shell fragments from damaging the Coulter LS 13 320, particles greater than 1 mm in diameter were separated from all samples prior to analysis with a number 18 (1000 µm) U.S. standard sieve, which meets the American Society for Testing and Materials (ASTM) E11 standard specifications for determining particle size with woven-wire test sieves. The samples were washed through the sieve with a 5 percent solution of sodium hexametaphosphate with filtered municipal water to act as a deflocculant. The sediment slurry was sonicated with a wand sonicator for 30–60 seconds before being introduced into the Coulter LS 13 320 to break down aggregated particles. Two subsamples from each sample were processed through the Coulter LS 13 320 with a minimum of four runs apiece. The Coulter LS 13 320 measures the particle-size distribution of each sample by passing sediment suspended in solution between two narrow panes of glass in front of a laser. The particles scatter light into characteristic refraction patterns that are measured by an array of photodetectors as intensity per unit area and recorded as relative volume for 92 size-classification channels, or bins. The size-classification boundaries for each bin were based on the ATSM E11 standard specification for wire cloth and sieves for testing purposes. The raw grain-size data were processed with the free software program, GRADISTAT version 8 (Blott and Pye, 2001; kpal.co.uk/gradistat),which calculates the mean, median, sorting, skewness, and kurtosis of each sample, geometrically in metric units and logarithmically in phi units (Φ) (Krumbein, 1934), using the Folk and Ward (1957) method. GRADISTAT also calculates the fraction of sediment from each sample by size category (for example, clay, coarse silt, fine sand) based on Friedman and Sanders (1978), a modified Wentworth (1922) size scale. A macro function in Microsoft Excel, developed by the USGS SPCMSC, was applied to the data to calculate the average and standard deviation for each sample set (8 runs per sample) and highlight runs that varied from the set average by more than ± 1.5 standard deviations. Excessive deviations from the mean are likely the result of equipment error or extraneous organic material in the sample and are not considered representative of the sample. The highlighted runs were removed from the results, and the sample average was recalculated using the remaining runs. The averaged run statistics and class-size distributions are included in this report's data downloads.
|

![]() U.S. Department of the Interior |
U.S. Geological Survey
U.S. Department of the Interior |
U.S. Geological Survey
URL: http://pubsdata.usgs.gov/pubs/ds/1046/ds1046_methods.html
Page Contact Information: GS Pubs Web Contact
Page Last Modified: Wednesday, 07-Jun-2017 11:47:57 EDT
