Data Series 1081
| Survey Overview and Data AcquisitionMore than 1,500 line-km of bathymetric data were collected in the nearshore coastal waters surrounding Ship Island (West and East) and Horn Island and in the associated passes (Camille Cut, Dog Keys Pass, and Horn Island Pass), GUIS, Mississippi, from July 13 to 19, 2016, during USGS FAN 2016-347-FA (fig. 2). This survey involved three vessels: the 25-foot (ft) research vessel (R/V) Sallenger (subFAN 16BIM04) collected IFB data, and the 20-ft R/V Jabba Jaw (subFAN 16BIM05) and the 16-ft R/V Mako (subFAN 16BIM06) collected SBB data (figs. 3–5; table 1).  Figure 2. Trackline map of the 2016 single-beam bathymetry (blue) and interferometric swath bathymetry (green) surveyed in the nearshore coastal waters of Ship (West and East) and Horn Islands, Gulf Islands National Seashore, Mississippi. The base map is derived from Landsat 8 imagery acquired January–February 2015 (Guy, 2015a, b). [Click figure to enlarge] Table 1. Summary of the July 2016 Field Activity Number (FAN) 2016-347-FA listing subFANs, data type, total trackline count, and total trackline length surveyed. [km, kilometer; IFB, interferometric swath bathymetry; SBB, single-beam bathymetry]
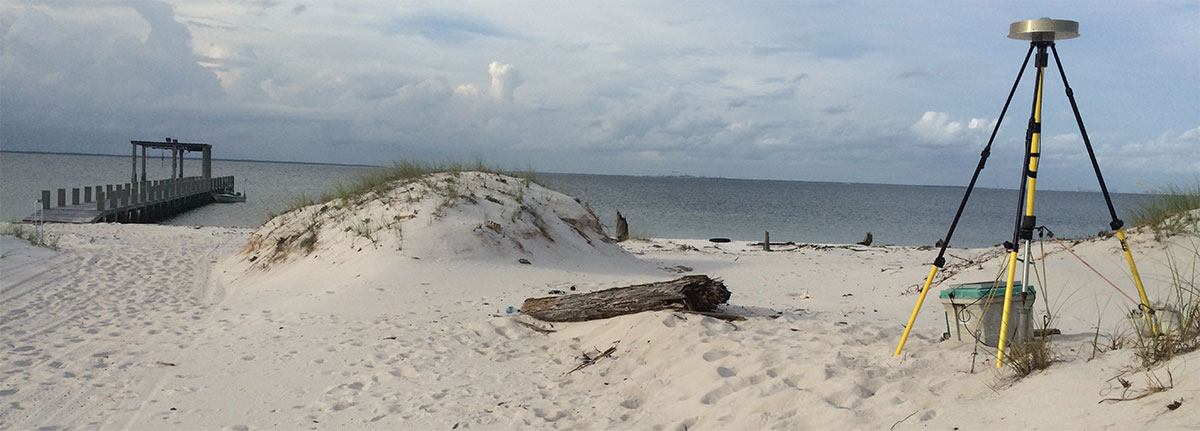
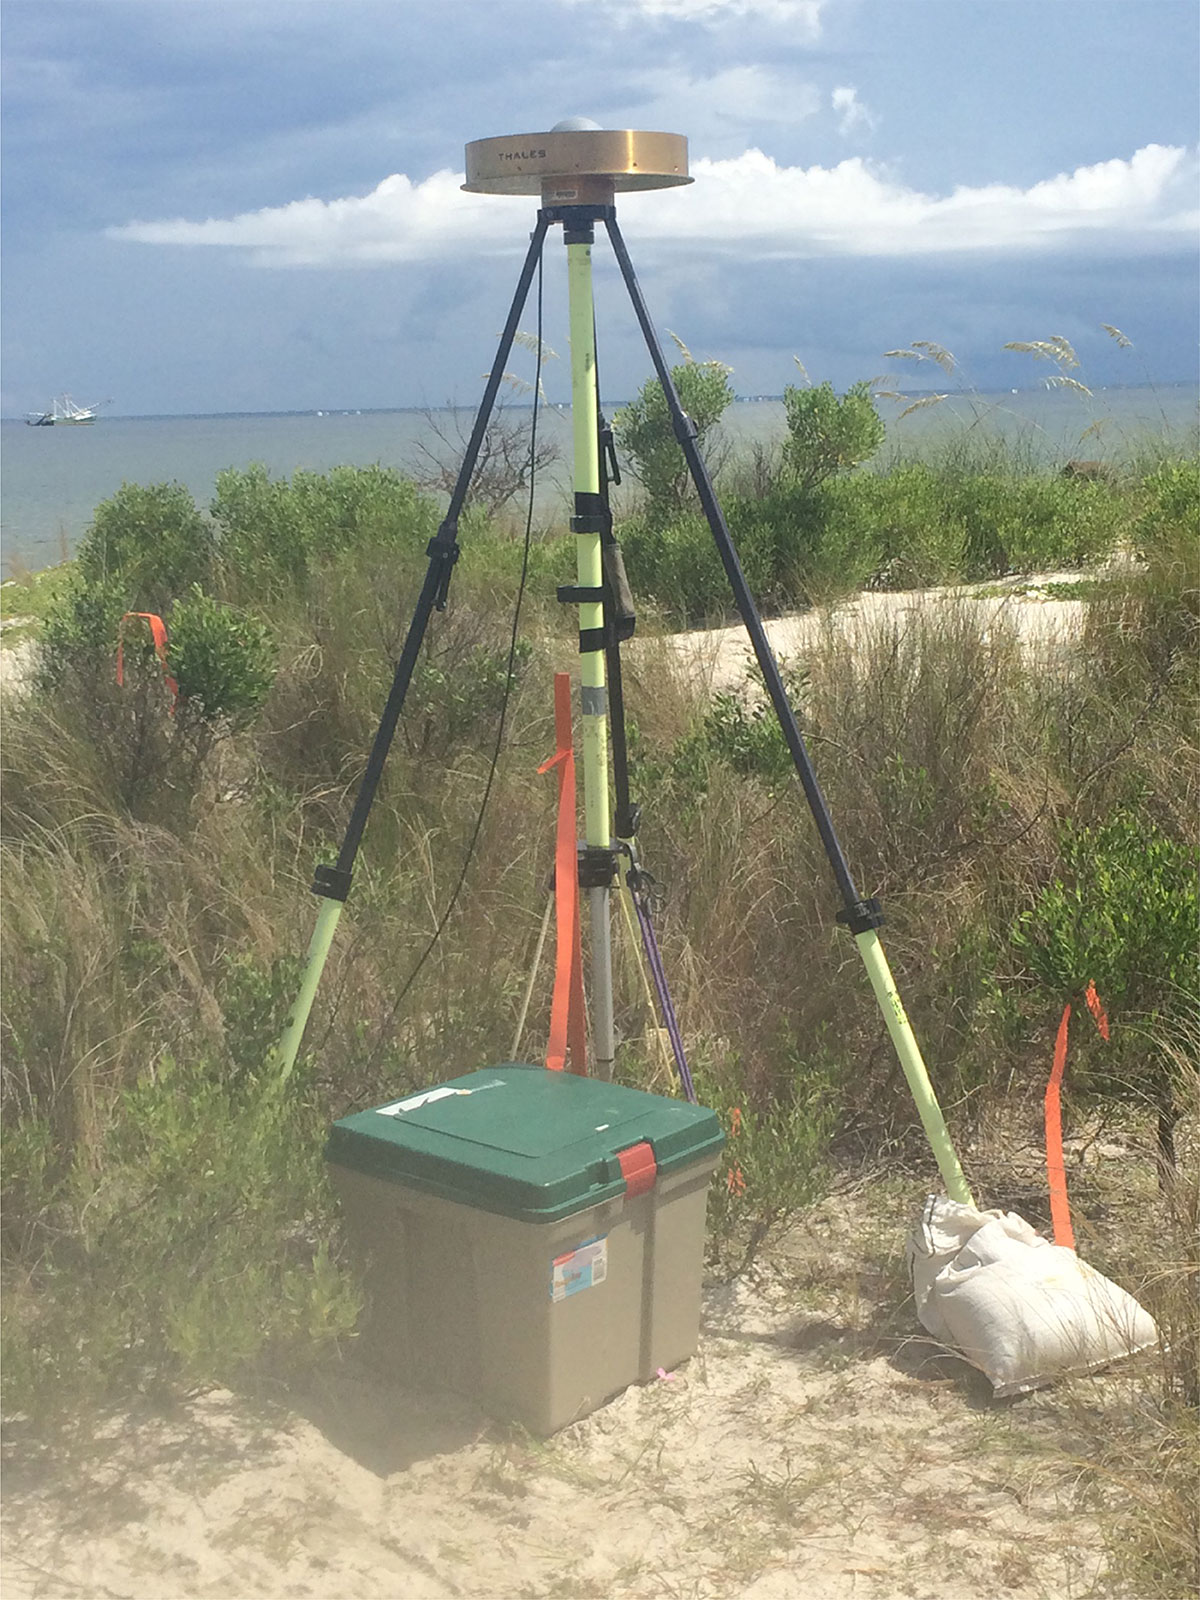
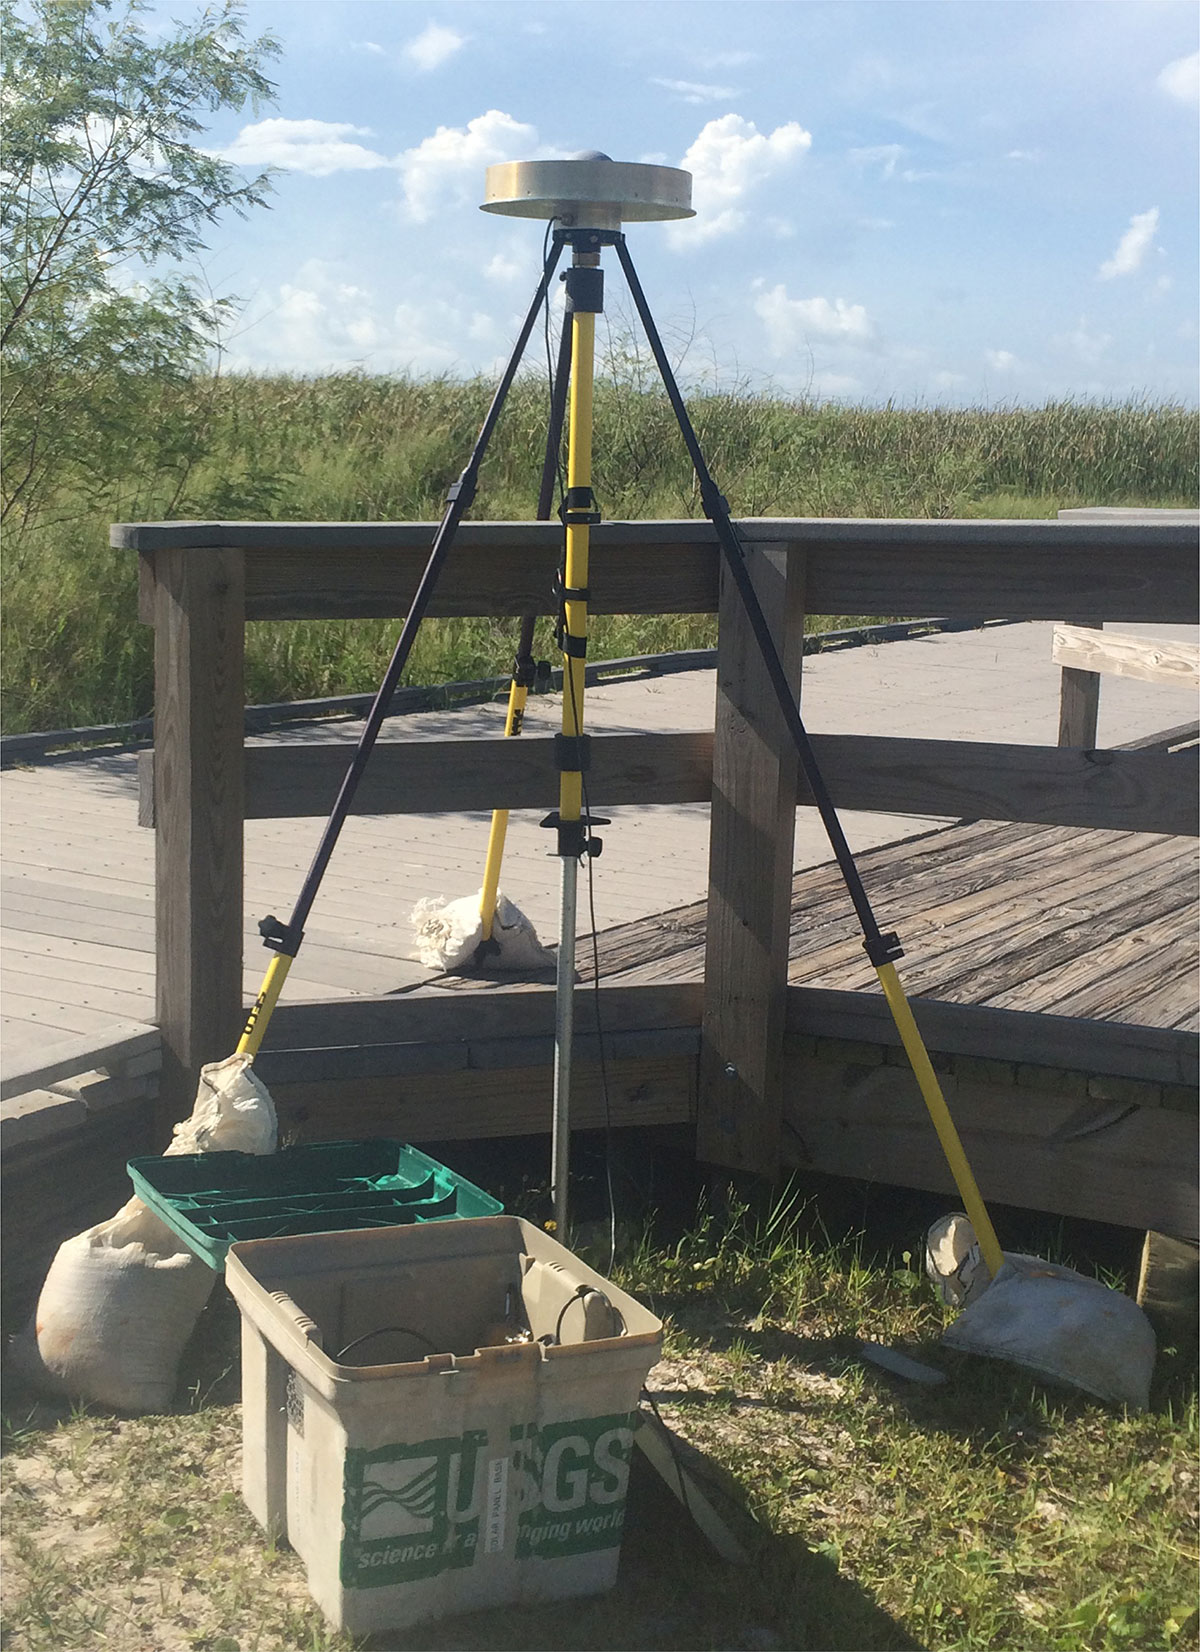
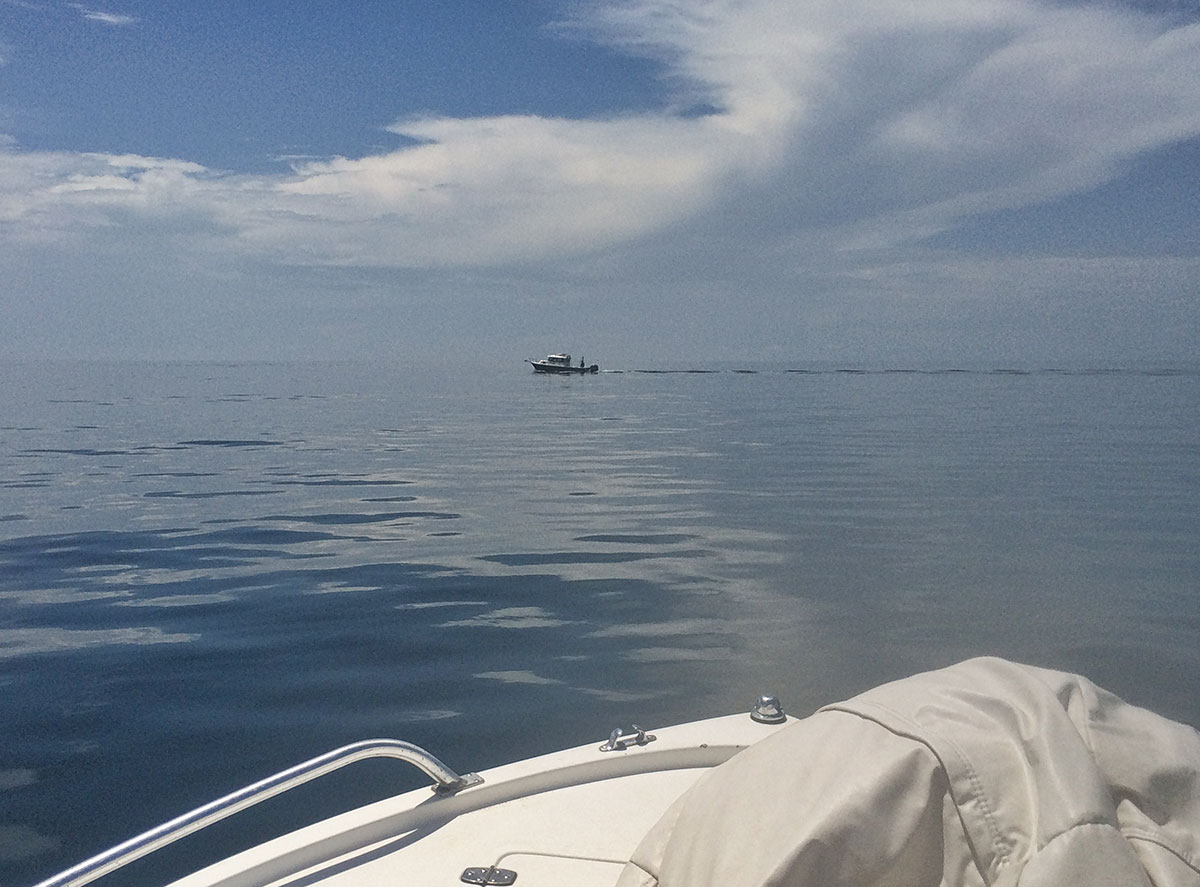 Figure 3. Photograph of the research vessel Sallenger surveying on the Gulf of Mexico side of Horn Island, Gulf Islands National Seashore, Mississippi. [Click image to enlarge]  Figure 4. Photograph of the research vessel Jabba Jaw at anchor. [Click image to enlarge]  Figure 5. Photograph of the research vessel Mako with single-beam bathymetry survey equipment, beached on the Mississippi Sound side of Horn Island, Gulf Islands National Seashore, Mississippi. [Click image to enlarge] Single-Beam Bathymetry | Interferometric Swath Bathymetry Single-Beam BathymetryNavigationDifferential Global Positioning System (DGPS) data were collected for the SBB surveys (subFANS 16BIM05 and 16BIM06) to improve the accuracy of the acquired bathymetry data. Global Positioning System (GPS) base stations were placed at three bench mark locations (two on Horn Island and one on West Ship Island) to provide a baseline of 15 km or less to the roving vessels. On Horn Island, the eastern bench mark, stamping 20-2Q 98, installed in 1998 (USACE), was located next to the NPS ranger station trailhead southeast of the pier (figs. 2, 6). The western bench mark, stamping WHRN 2008 (USGS SPCMSC), was located on the western tip of the island, on top of a short sand ridge (figs. 2, 7). The West Ship Island bench mark, Permanent Identifier (PID) BBCL83, stamping 4756 F 2011 (John Oswald and Associates, LLC), was located on the north side of the intersection where the main boardwalk meets the generator shed boardwalk (figs. 2, 8).
All base stations were equipped with an Ashtech ProFlex GPS receiver and an Ashtech choke-ring antenna. The Ashtech ProFlex GPS receivers (table 2) recorded at a rate of 5 hertz (Hz) or every 0.2 seconds (s). The Ashtech ProFlex GPS receiver and antenna combination was duplicated on each survey vessel and recorded the vessels’ GPS position concurrently at the same rate as the base stations (every 0.2 s). HYPACK, a marine surveying, positioning, and navigation software package, managed the planned line information and provided real-time navigation and instrumentation-status information to the boat operator (HYPACK version 15.0.9.71). Data were collected in the World Geodetic System of 1984 (WGS84) realization G1762, which is equivalent to International Terrestrial Reference Frame of 2008 (ITRF08). Table 2. Specifications for the Ashtech ProFlex 500 and Ashtech ProFlex 800 Global Positioning System (GPS) receivers used during the single-beam bathymetry survey are available in Portable Document Format (PDF) through the following links: Ashtech ProFlex 500 (228-KB PDF) and Ashtech ProFlex 800 (194-KB PDF).
[mm, millimeter; ft, foot; ppm, part per million]
Soundings and MotionDepth soundings were acquired at 50-millisecond (ms) intervals using an Odom Echotrac CV100 echosounder system with a 200-kilohertz (kHz) 4-degree transducer (table 3). Boat motion was recorded on the R/V Jabba Jaw (subFAN 16BIM05) at 20-ms intervals using an SBG Ellipse-A miniature motion sensor (table 4). The R/V Mako (subFAN 16BIM06) recorded motion at 20-ms intervals using a Teledyne TSS Dynamic Motion Sensor DMS-05 (table 5). All sensor data were saved as a single raw data file (.raw) in HYPACK, and each device string was referenced by a device identification code and time stamped in Coordinated Universal Time (UTC). This survey resulted in approximately 667 line-km of SBB data (fig. 9). Table 3. Specifications for the Odom Echotrac CV100 echosounder used during the single-beam bathymetry survey. The equipment specifications are available in Portable Document Format (PDF) at the following link: Odom Echotrac CV100 (116-KB PDF).
[<, less than; m, meter; RMS, root mean square; cm, centimeter; ±, plus or minus; kHz, kilohertz]
Table 4. Specifications for the SBG Ellipse, a miniseries high performance motion sensor used during the single-beam bathymetry survey. The equipment specifications are available in Portable Document Format (PDF) at the following link: SBG Ellipse-A (1,331 KB PDF).
[cm, centimeter; %, percent]
Table 5. Specifications for the Teledyne TSS DMS-05 motion sensor used during the single-beam bathymetry survey. The equipment specifications are available in Portable Document Format (PDF) at the following link: Teledyne TSS DMS-05 (202 KB PDF).
[cm, centimeter; %, percent]
Sound VelocityWater column sound velocity profile (SVP) measurements were collected by each vessel throughout the survey. A SonTek Castaway Conductivity, Temperature, and Depth (CTD) instrument (table 6) was deployed from the R/V Jabba Jaw (24 profiles) andthe R/V Mako (37 profiles) to measure changes in the water column speed of sound (SOS). The recorded profiles were imported into the post-processing software to correct the depth for temporal and spatial SOS changes throughout the water column.
Table 6. Specifications for the SonTek CastAway-CTD profiler used during the single-beam bathymetry survey. The equipment specifications are available in Portable Document Format (PDF) through the following link: SonTek CastAway-CTD (520-KB PDF).
[m/s, meter per second; ±, plus or minus]
![Figure 9. Trackline map of the 2016 single-beam bathymetry (667 line-km [260 lines]) surveyed in the nearshore coastal waters of Ship and Horn Islands, Gulf Islands National Seashore, Mississippi](images/Ship_Horn_2016_Location_SBB_Trackline_map_1200.jpg) Figure 9. Trackline map of the 2016 single-beam bathymetry (667 line-km [260 lines]) surveyed in the nearshore coastal waters of Ship (West and East) and Horn Islands, Gulf Islands National Seashore, Mississippi. The base map is derived from Landsat 8 imagery acquired January–February 2015 (Guy, 2015a, b). [Click figure to enlarge] Interferometric Swath BathymetryNavigation and MotionNavigation and motion data for the IFB survey (subFAN 16BIM04) were recorded in real time using a Coda Octopus F190R+ Precision Attitude and Positioning System (table 7) consisting of a top-side GPS receiver, two GPS antennas, and a waterproof inertial measurement unit (IMU). The NovAtel GPS antennas were mounted atop the cabin of the R/V Sallenger, and real-time-corrected positions were acquired via Marinestar High Precision (HP) DGPS subscription service from Fugro. The IMU was mounted underwater between the swath transducer heads and applied real-time measurements for vessel motion (heave, roll, and pitch). The F190R+ software program accounted for equipment offsets, and a system calibration was performed every survey day prior to data acquisition. The corrected positions from Marinestar HP and motion from the IMU were integrated with the observed interferometric soundings using Bathyswath software (version 3.10.2.0), generating real-time-corrected position (x,y) and elevation (z) of the seafloor across the swath range. HYPACK (version 15.0.9.7) managed the planned line information and provided real-time navigation and instrumentation-status information to the boat operator. Data were collected in WGS84 (G1762), which is equivalent to ITRF08.
Table 7. Specifications for the Coda Octopus F190R+ inertial measurement unit used during the interferometric swath bathymetry survey. The equipment specifications are available in Portable Document Format (PDF) at the following link: Coda Octopus F180 Series (1.84-MB PDF).
[m, meter; m/s, meter per second; σ, standard deviation; cm, centimeter; %, percent]
SoundingsThe IFB data were collected aboard the R/V Sallenger using a 468-kHz Systems Engineering and Assessment Ltd. (SEA) SWATHplus-H (high frequency) interferometric sonar system (table 8). The transducer system was fastened to a static pole mount deployed over the starboard side gunnel. Data were collected with Bathyswath version 3.10.2.0, an acquisition and initial processing program. Preliminary roll calibration trackline data were collected and processed using Bathyswath Grid Processor software version 3.10.0.0. Prior to deployment, all physical equipment offsets were surveyed in dry dock with a laser total station. The instrument position and roll calibration offsets were entered into the Bathyswath session file (.sxs), and all swath tracklines were recorded in raw data format (.sxr). This survey resulted in approximately 844 line-km of IFB data (fig. 10). Table 8. Specifications for the Systems Engineering and Assessment Ltd. SWATHplus-H sonar system transducers used to collect interferometric swath bathymetry data. The equipment specifications are available in Portable Document Format (PDF) through the following link: SWATHplus-H (175-KB PDF).
[kHz, kilohertz; m, meter; cm, centimeter; µs, microsecond]
Sound VelocityAccurate SOS values throughout the water column are essential for accurate seafloor mapping with a swath system, particularly at maximum swath beam range extents and most notably at depths greater than 3 meters (m), where sound velocity often varies because of thermoclines and changes in salinity. If SOS values are inaccurate, water column refraction can decrease data precision and accuracy throughout the beam range of the swath signal, particularly at the far range. A Valeport miniature Sound Velocity Sensor (miniSVS) (table 9) was attached to the transducer mount and collected continuous sound velocity measurements at the depth of the transducers. These values were imported into the Bathyswath program during raw data acquisition, providing a real-time SOS at the transducer while underway. In addition, a separate SonTek Castaway-CTD was used to collect SOS profiles (water surface to seafloor) throughout the survey (table 6).
Table 9. Specifications for the Valeport miniSVS used to collect continuous sound velocity measurements. The miniSVS was co-located with the bathymetry transducers and inertial motion unit. The equipment specifications are available in Portable Document Format (PDF) through the following link: Valeport miniSVS (148-KB PDF).
[m/s, meter per second; mm, millimeter; ±, plus or minus; Hz, hertz]
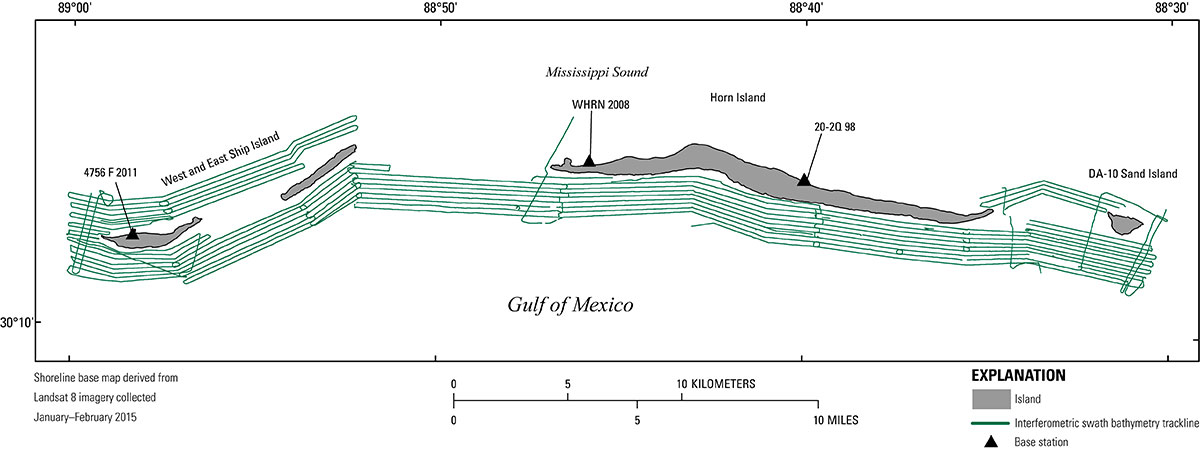 Figure 10. Trackline map of the 2016 interferometric swath bathymetry (844 line-kilometers [147 lines]) surveyed in the nearshore coastal waters of Ship (West and East) and Horn Islands, Gulf Islands National Seashore, Mississippi. The base map is derived from Landsat 8 imagery acquired January–February 2015 (Guy, 2015a, b). [Click figure to enlarge] Note: To view PDF documents the latest version of Adobe Reader or similar software is required. Disclaimer: Any use of trade names is for descriptive purposes only and does not imply endorsement by the U.S. Government. | |||||||||||||||||||||||||||||||||||||||||||||||||||||||||||||||||||||||||||||||||||||||||||||||||||||||||||||||||||||||||||||

![]() U.S. Department of the Interior |
U.S. Geological Survey
U.S. Department of the Interior |
U.S. Geological Survey
URL: http://pubsdata.usgs.gov/pubs/ds/1081/ds1081_overview.html
Page Contact Information: GS Pubs Web Contact
Page Last Modified: Thursday, 12-Apr-2018 14:43:31 EDT