Data Series 1095
| Data ProcessingNavigationThe coordinate values for each of the GPS base stations (BH17 and WHRN, fig. 4) are the time-weighted average of values obtained from the NGS Online Positioning User Service (OPUS). The base-station coordinates were imported into the processing software, GrafNav version 8.6 (Waypoint Products Group), and the kinematic GPS data from the survey vessel were post-processed to the concurrent GPS data from the base stations. In all cases, the closest base station to the roving vessel was used to keep vertical error to a minimum. The final, differentially corrected, precise DGPS positions for each vessel were computed at their respective intervals (5 Hz (0.2 s) for 15BIM10 and 15BIM11, and 10 Hz (0.1 s) for 15BIM12 and 15BIM13), and then exported in American Standard Code for information interchange (ASCII) text format. The GPS data were processed and exported in World Geodetic System 1984 (WGS84 (G1150)) geodetic datum, which is equivalent to the International Terrestrial Reference Frame 2000 (ITRF2000) (Merrigan and others, 2002; Soler and Snay 2004). Soundings and MotionThe raw HYPACK data files were imported into the CARIS Hydrographic Information Processing System and Sonar Information Processing System (HIPS and SIPS) version 9.1.1. The post-processed DGPS positions exported from GrafNav were also imported into the CARIS software using the generic data-parser tool, thus replacing the uncorrected real-time rover position recorded during acquisition. After parsing, the navigation data were scanned using the “Navigation Editor” to verify the replacement occurred, and then the SVP profile casts were imported using the SVP editor and applied. The bathymetric data components (position, motion, depth, and SOS) were then merged and geometrically corrected in the CARIS software to produce processed x,y,z point data. The data were then edited for outliers and reviewed using the “Subset Editor” utility to identify crossing line offsets or other problem areas and remove erroneous data points. Erroneous soundings are usually obvious and related to cavitation in the water column, which can obscure the fathometer signal; to tight turns in the surf zone that can affect the tracking of incoming GPS signals; or to general equipment issues. Soundings in areas of extremely shallow water (0.30–0.50 m)—over sandbars or seagrass beds, for example—are reviewed against the surrounding data for coherence. The processed point data were exported as an x,y,z ASCII text file referenced to WGS84 (G1150), equivalent to ITRF2000 and ellipsoid height in meters. Vertical TransformationUsing the National Oceanic and Atmospheric Administration (NOAA) transformation software, VDatum version 3.6, the data were transformed horizontally and vertically from ITRF2000 into North American Datum 1983 (NAD83 (CORS96)) and North American Vertical Datum of 1988 (NAVD88 (orthometric height)) using the NGS geoid model of 2012A (GEOID12A). The data were then transformed from NAD83 (CORS96) and NAVD88 GEOID12A to NAD83 (CORS96) and mean lower low water (MLLW). The x,y,z point datasets can be downloaded from the data downloads page in this Data Series report or from the associated data release DeWitt and others (2017). Digital Elevation Model (DEM)The processed x,y,z point data (ASCII files) from each platform were imported into Esri ArcGIS ArcMap version 10.3 and merged into a single shapefile for gridding. A triangulated irregular network (TIN) was generated from the point data using the “Create TIN” tool (3D analyst toolbox) and was constrained using a 0-meter shoreline extracted from 2015 USGS Dauphin Island lidar data (Flocks and others, 2017; USGS, 2017). A DEM was produced using the ArcGIS “TIN to Raster” tool by applying the natural neighbor algorithm at 50-m by 50-m spacing. Lastly, the raster DEM was clipped to the survey extent using the spatial analyst extract tool “Extract by Mask.” A DEM was created for each dataset datum (1) ITRF2000; (2) NAD83 (CORS96)–NAVD88 GEOID12A (fig. 5); and (3) NAD83 (CORS96) and MLLW. Each DEM has a link in the data downloads table within this report. The DEM files can be downloaded from the data downloads page in this Data Series report or from the associated data release DeWitt and others (2017). 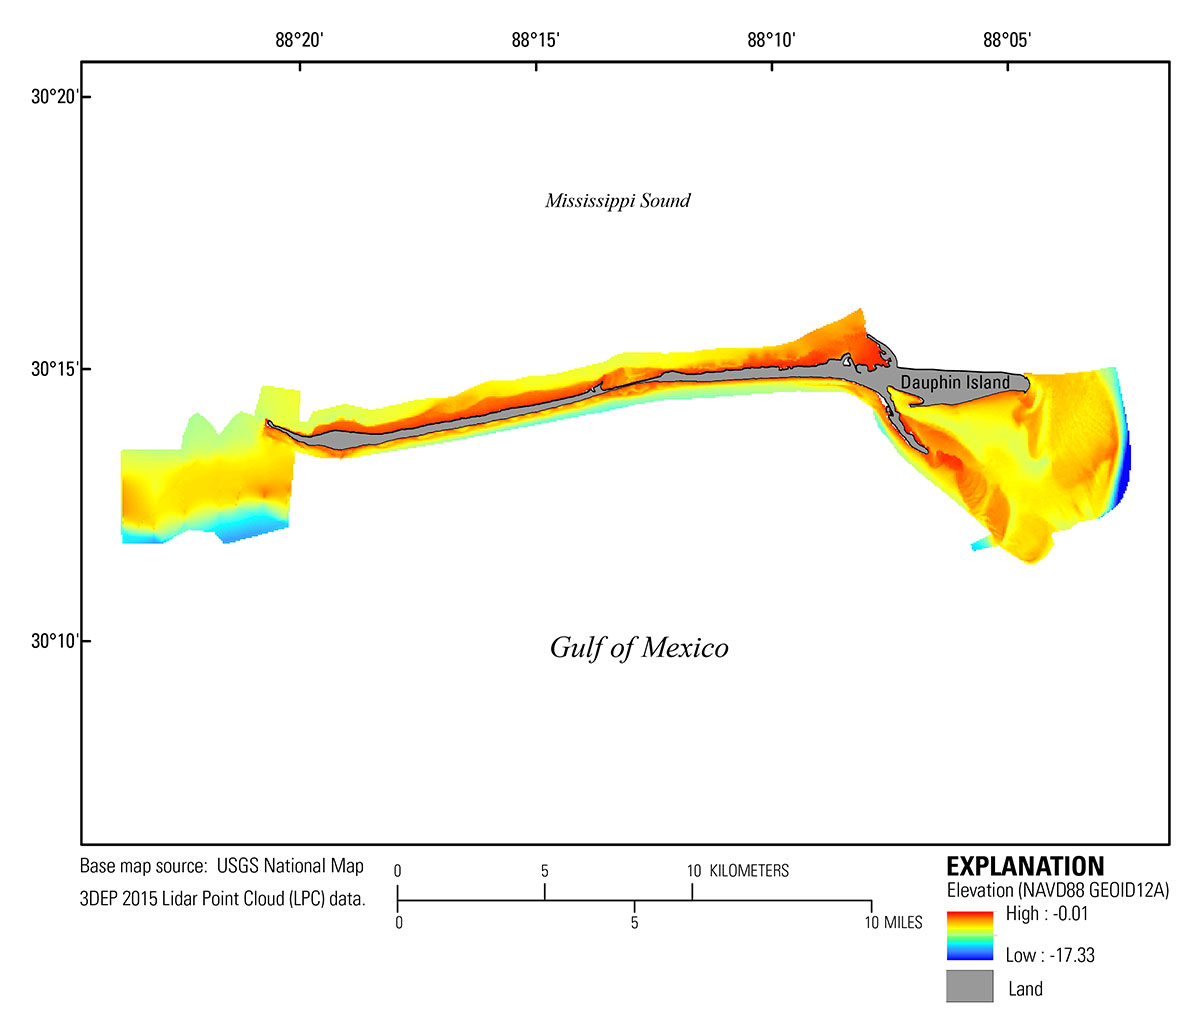 Figure 5. The 50-meter (m) digital elevation model (DEM) for the 2015 Dauphin Island, Alabama, single-beam dataset. Horizontal data are referenced to North American Vertical Datum of 1983 (NAD83) Universal Transverse Mercator (UTM) Zone 16 North, and the vertical data are referenced to North American Vertical Datum 1988 (NAVD88) using the GEOID12A model. Island polygon is derived from 2015 U.S. Geological Survey National Map lidar data. [Click figure to enlarge] Note: Any use of trade names is for descriptive purposes only and does not imply endorsement by the U.S. Government. |

![]() U.S. Department of the Interior |
U.S. Geological Survey
U.S. Department of the Interior |
U.S. Geological Survey
URL: http://pubsdata.usgs.gov/pubs/ds/1095/ds1095_data-processing.html
Page Contact Information: GS Pubs Web Contact
Page Last Modified: Tuesday, 02-Oct-2018 15:52:24 EDT
