Data Series 1095
| Survey Overview and Data AcquisitionApproximately 1,165 km of single-beam bathymetric data were collected in the nearshore around Dauphin Island, Ala., from August 20 to 24, 2015 (USGS FAN 2016–326–FA; fig. 2). The survey involved four vessels (fig. 3): the 25-foot (ft) R/V Sallenger (subFAN 15BIM10), the 20-ft R/V Jabba Jaw (subFAN 15BIM11), and two 12-ft Yamaha Personal Watercraft (PWC) specially outfitted for SBB acquisition—the R/V Shark and the R/V Chum, (subFAN 15BIM12 and 15BIM13, respectively). 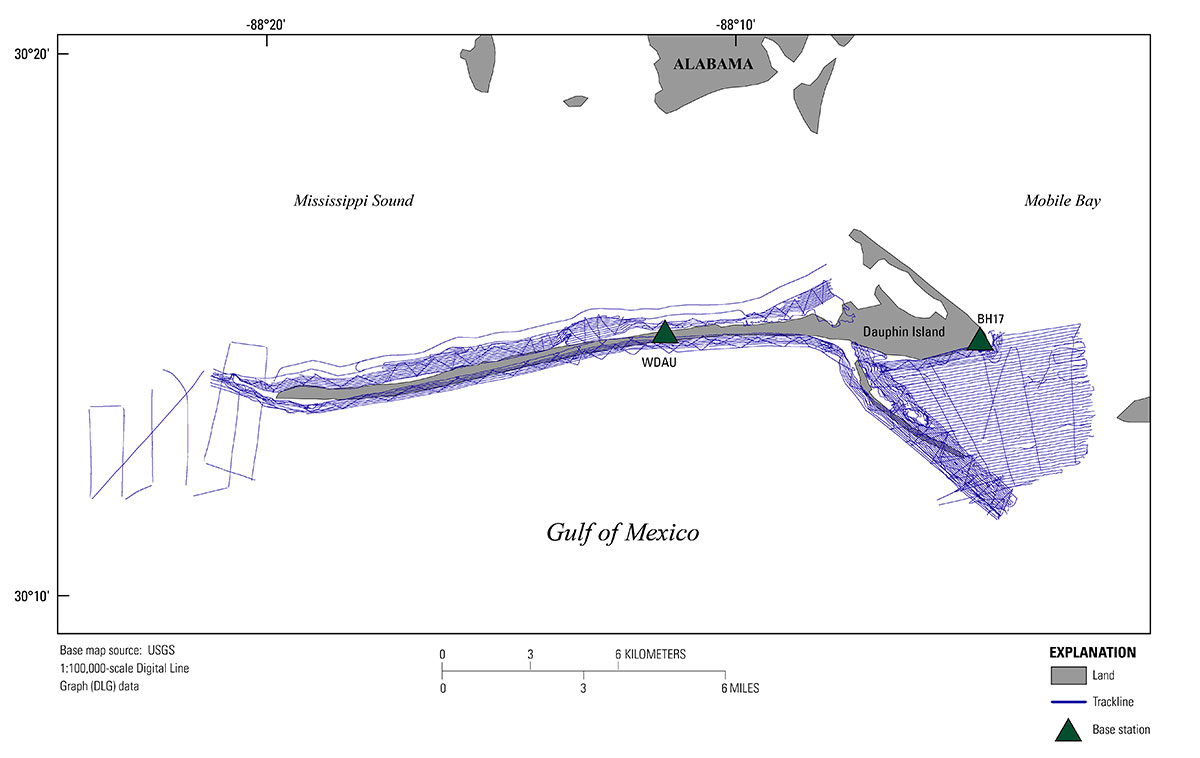 Figure 2. Trackline map of the 2015 single-beam bathymetry lines surveyed around Dauphin Island, Alabama. The base station at the bench mark with Permanent Identifier BH1755 is referenced as base station BH17; the base station at the temporary West Dauphin bench mark (stamped WDAU 2015) is referenced as base station WDAU. [Click figure to enlarge] 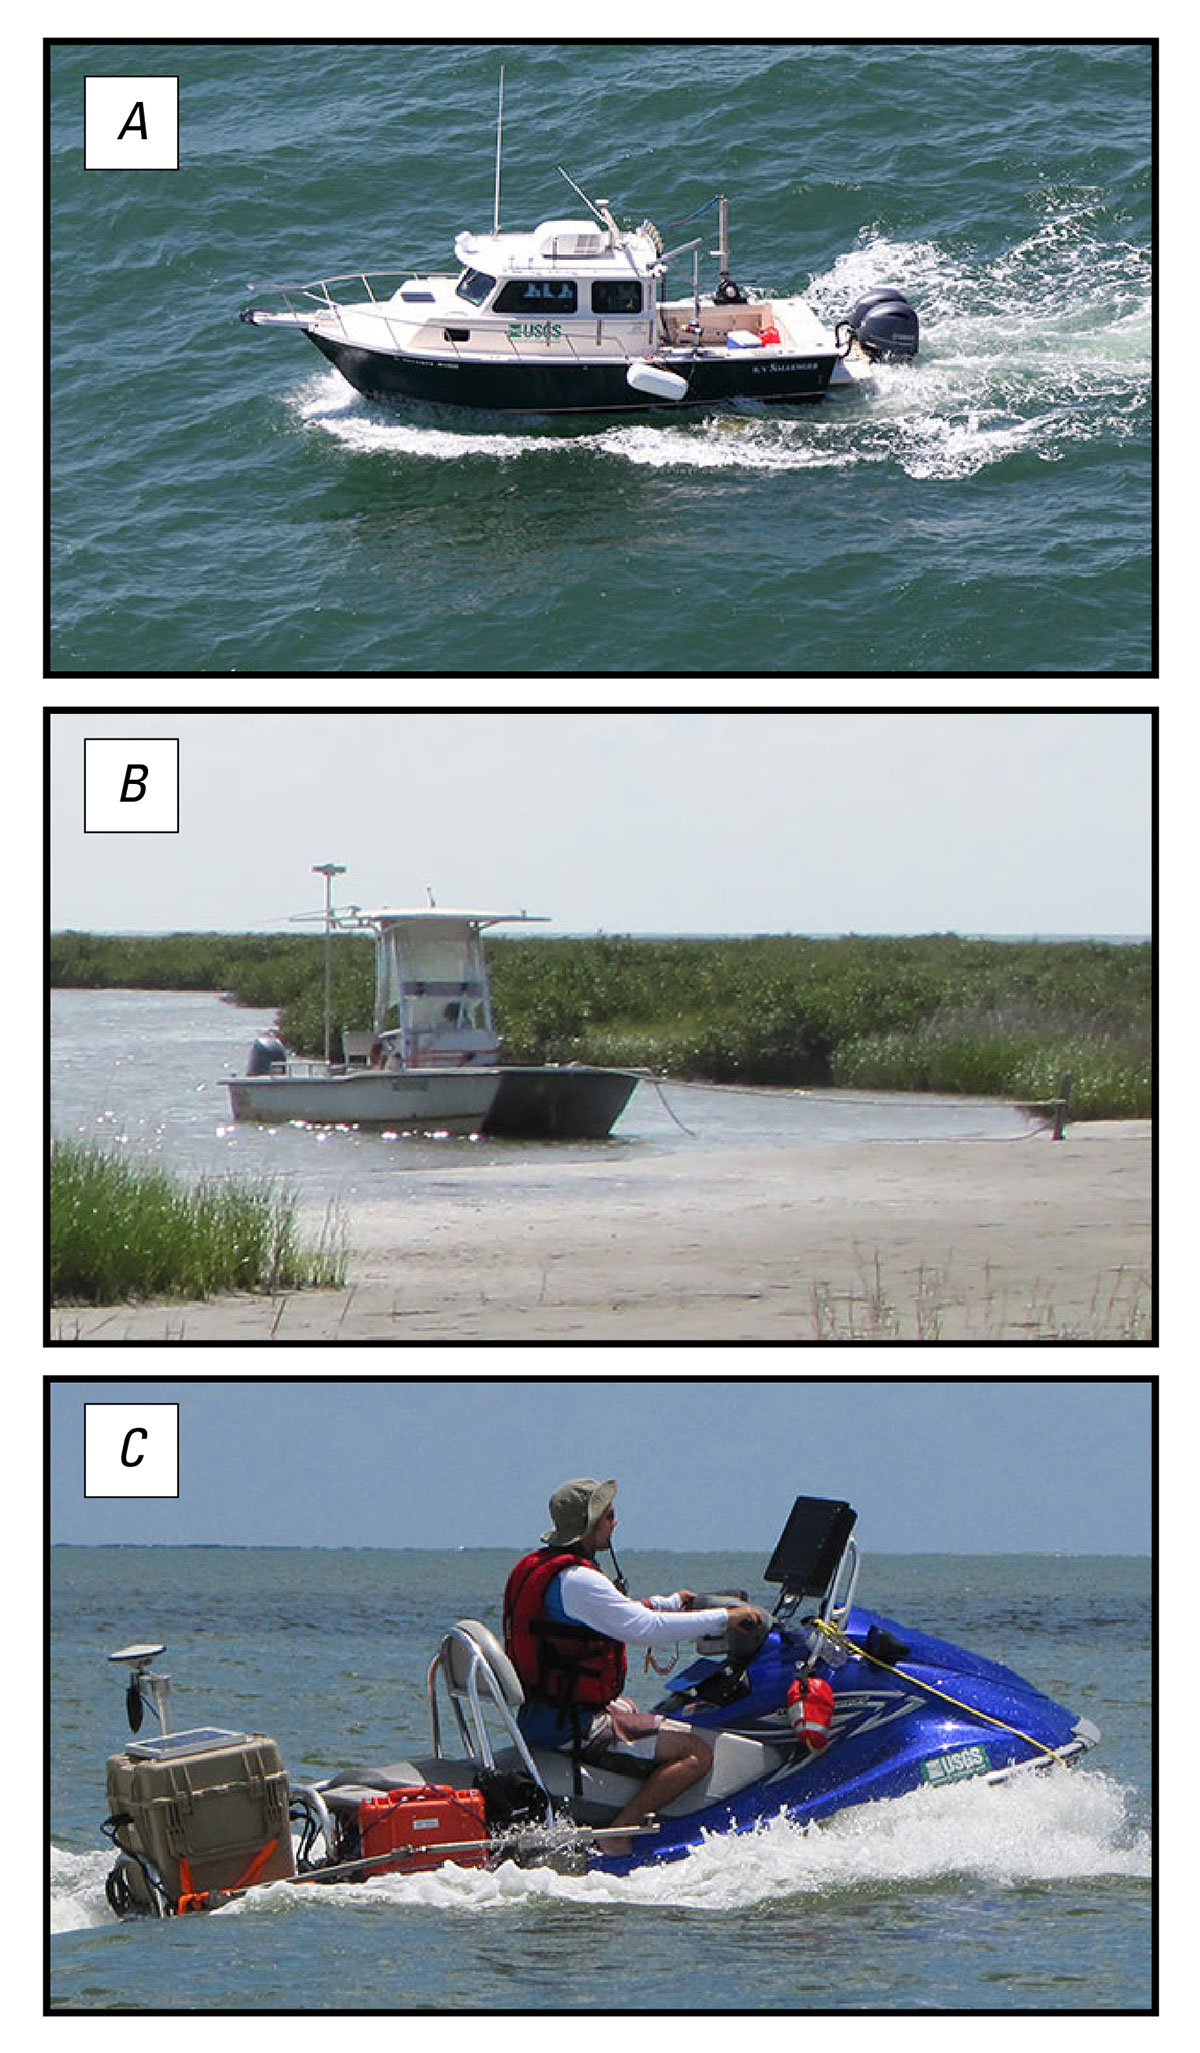 Figure 3. Photographs of (A) the research vessel (R/V) Sallenger underway, (B) the R/V Jabba Jaw at anchor, and (C) the R/V Chum underway. [Click figure to enlarge] NavigationDifferential Global Positioning System (DGPS) data were collected for the SBB surveys to improve the x,y,z accuracy of the acquired data. Two Global Positioning System (GPS) base stations were placed on bench marks located at the west and east ends of the island, providing a 15-km baseline distance to any of the roving vessels. The base station at the east end of the island was erected upon a National Geodetic Survey (NGS) bench mark, Permanent Identifier (PID) BH1755 (stamping 5180 B 1976), located at the eastern public entrance into historic Fort Gaines (figs. 2 and 4). NGS bench marks listed in the NGS database, near the West End Beach Park public access, were not recovered, possibly due to shoreline migration, destruction, or burial caused by previous storms. The USGS subsequently installed the West Dauphin bench mark (stamping WDAU 2015) along the eastern side of the West End Beach Park public parking lot (figs. 2 and 4) to provide coverage in this area. Each base station was equipped with an Ashtech ProFlex 800 CORS GPS receiver (table 1) and Ashtech choke-ring antenna mounted on a tripod. The base GPS receiver recorded at a rate of 10 hertz (Hz) (0.1 seconds (s)) during the survey. A similar receiver and antenna combination was duplicated on each survey vessel (which were referred to as rovers) and recorded GPS position concurrently (5 Hz (0.2 s) for 15BIM10 and 15BIM11; 10 Hz (0.1 s) for 15BIM12 and 15BIM13) throughout the survey. HYPACK, a marine surveying, positioning, and navigation software package was used to manage the planned line information and provide real-time navigation and instrumentation-status information to the boat operator. HYPACK version 14.0.9 was used for 15BIM10 and version 13.0.09 was used for 15BIM11-13. 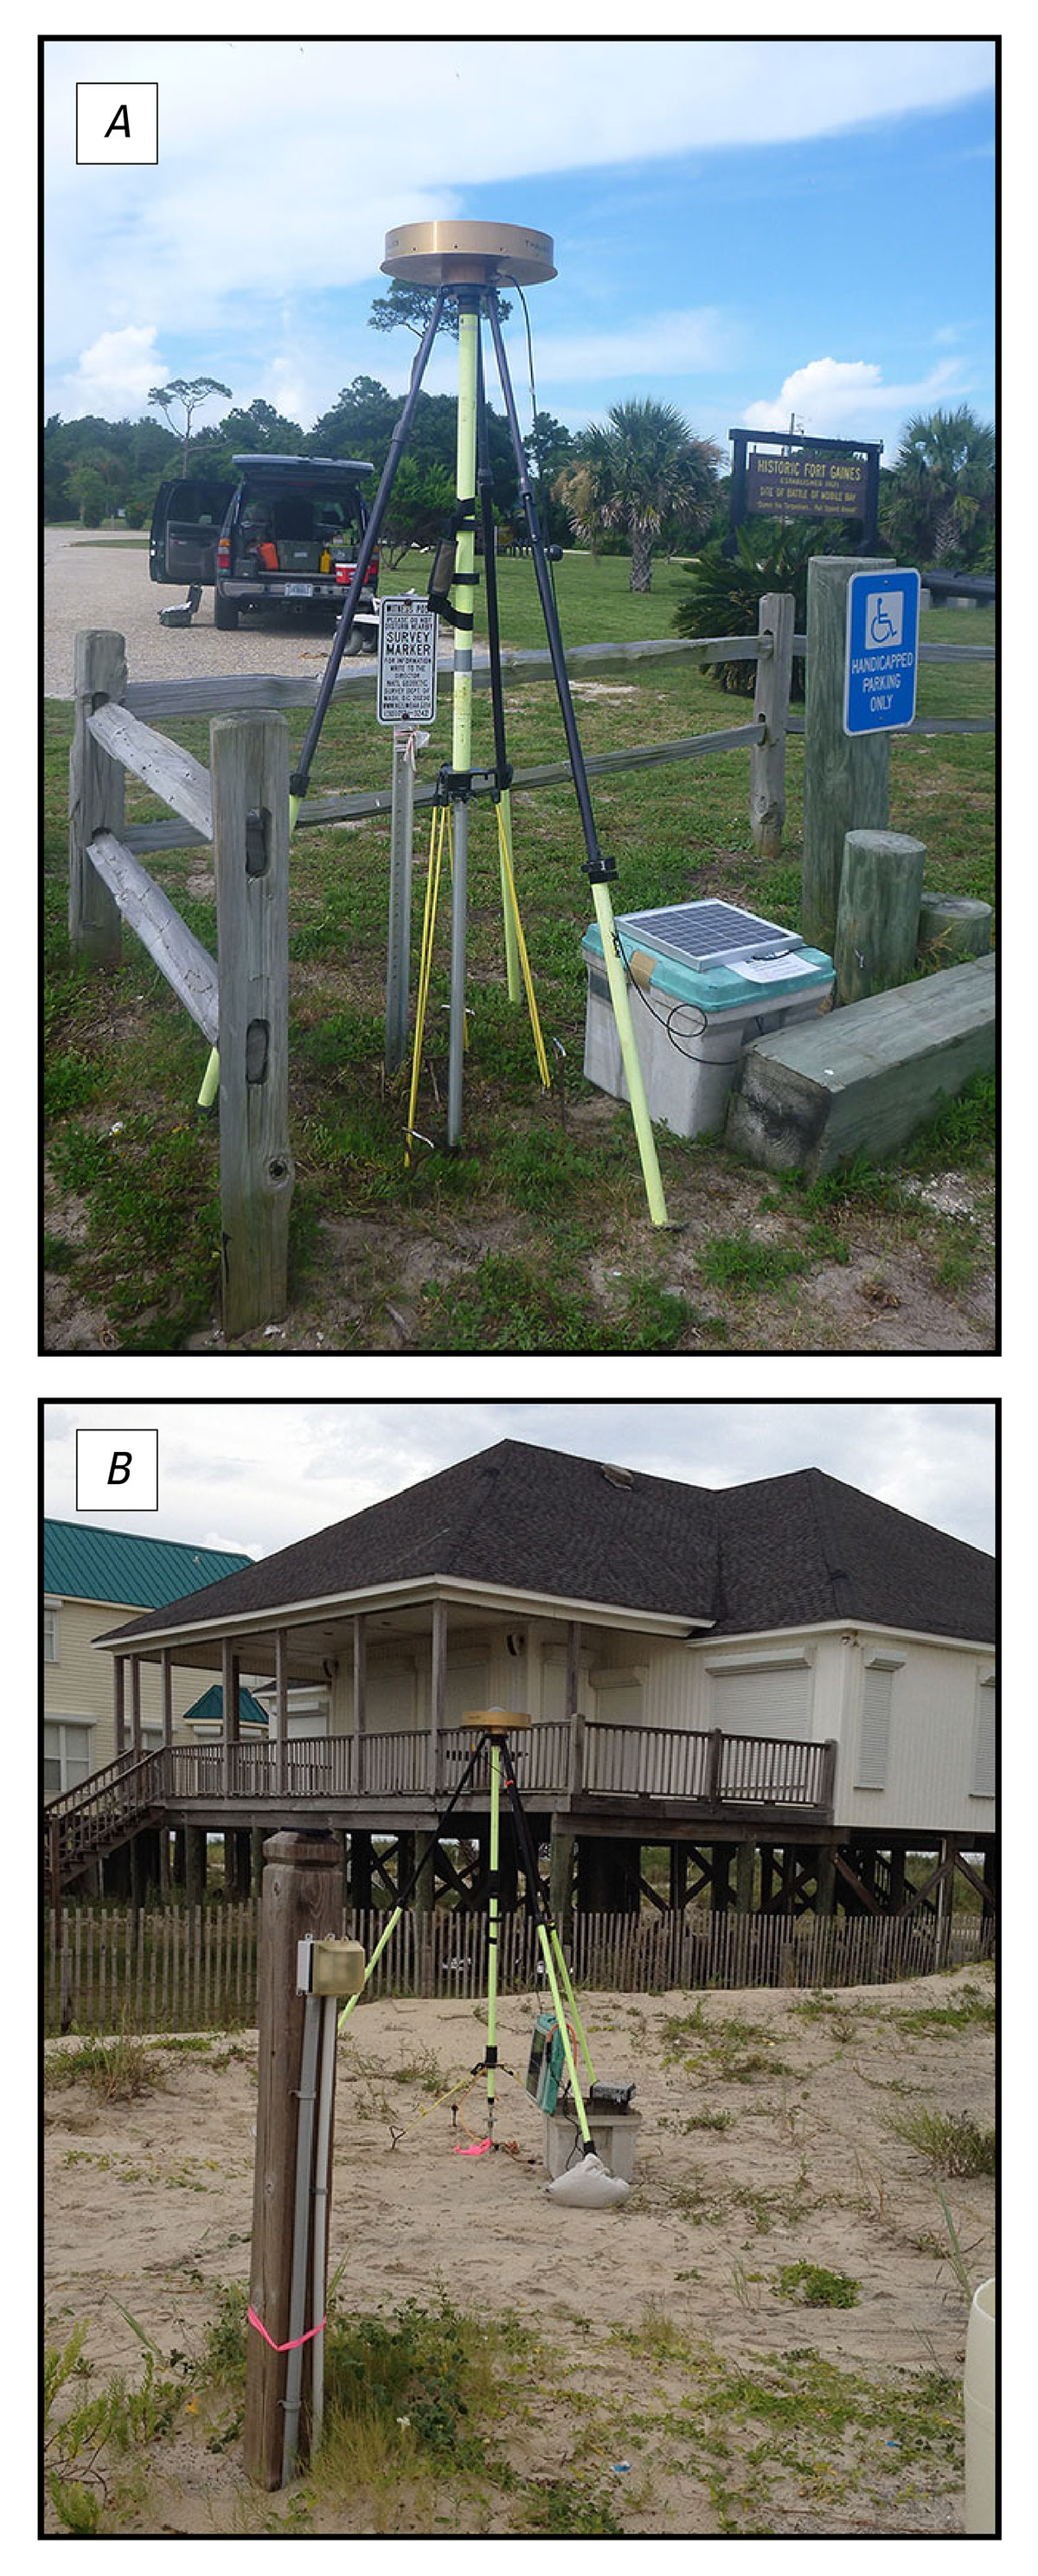 Figure 4. Photographs from the 2015 bathymetry survey showing the bench mark locations of the (A) National Geodetic Survey, Permanent Identifier BH1755 (stamping 5180 B 1976) on the east side of the island, and (B) the temporary U.S. Geological Survey bench mark WDAU (stamping WDAU 2015) in the middle of Dauphin Island, Alabama, located at West End Beach Park. [Click figure to enlarge] Soundings and MotionDepth soundings were acquired at 50-millisecond (ms) intervals using a Teledyne Odom Echotrac CV100 echosounder system with a 200-kilohertz (kHz) transducer (fig. 4 and table 2). Boat motion was recorded on the R/V Sallenger (15BIM11) and the R/V Jabba Jaw (15BIM11) at 50-ms intervals using a Teledyne TSS Dynamic Motion Sensor (TSS-DMS-25 and TSS-DMS-05, respectively; table 3). The R/V Shark and the R/V Chum did not record boat motion. These vessels recorded GPS at a high rate (10 Hz (0.1 s)) using the Ashtech ProFlex 800 CORS GPS receiver and a short antenna (lever-arm) in combination with a narrow (4-degree) transducer beam to compensate for motion and minimize errors. All sensor data were saved as a single raw data file (.raw) in HYPACK, with each device string referenced by a device identification code and time stamped in Coordinated Universal Time (UTC). Sound VelocityWater column sound-velocity profile (SVP) measurements were collected by each vessel throughout the survey. A SonTek Castaway Conductivity, Temperature, and Depth (CTD) instrument (table 4) was deployed from the R/V Jabba Jaw, the R/V Shark, and the R/V Chum (15BIM11, 15BIM12, and 15BIM13 respectively). A Valeport mini-SVP was deployed from the R/V Sallenger (table 5). These instruments were periodically cast overboard to measure changes in the water column speed of sound (SOS). The recorded profiles were incorporated into the post-processing software to correct the depth for temporal and spatial SOS changes throughout the water column.
Table 1. Specifications for the Ashtech ProFlex 500 and Ashtech ProFlex 800 CORS Global Positioning Systems (GPS) receivers used during the single-beam bathymetry survey are available in Portable Document Format (PDF) through the following links: Ashtech ProFlex 500 (228-KB PDF) and Ashtech ProFlex 800 CORS (194-KB PDF).
[mm, millimeter; ft, foot; ppm, part per million]
Table 2. Specifications for the Teledyne Odom Echotrac CV100 echosounder used during the single-beam bathymetry survey, Teledyne Odom_Echotrac_CV100 (116-KB PDF).
[<, less than; m, meter; W, watts; RMS, root mean square; cm, centimeter; %, percent; kHz, kilohertz]
Table 3. Specifications for the Teledyne TSS-DMS-05 and TSS-DMS-25 motion sensors used during the single-beam bathymetry survey, Teledyne TSS-DMS-05 and_TSS-DMS-25 datasheet (223-KB PDF).
[cm, centimeters; %, percent]
Table 4. Specifications for the SonTek CastAway CTD profiler used during the single-beam bathymetry survey, SonTek CastAway-CTD profiler (520-KB PDF).
[m/s, meters per second; ±, plus or minus].
Table 5. Specifications for the Valeport MiniSVS used to collect continuous sound velocity, co-located with the bathymetry transducers and inertial motion unit, Valeport_miniSVS (148-KB PDF).
[m/s, meters per second; ±, plus or minus]
Note: Any use of trade names is for descriptive purposes only and does not imply endorsement by the U.S. Government. |
||||||||||||||||||||||||||||||||||||||||||||||||||||||||||||||

![]() U.S. Department of the Interior |
U.S. Geological Survey
U.S. Department of the Interior |
U.S. Geological Survey
URL: http://pubsdata.usgs.gov/pubs/ds/1095/ds1095_overview.html
Page Contact Information: GS Pubs Web Contact
Page Last Modified: Tuesday, 02-Oct-2018 16:00:54 EDT
