Data Series 1095
|
Error AnalysisSingle BeamThe ASCII files from each platform were imported into Esri ArcGIS ArcMap version 10.3, merged into a single shapefile, and reviewed for spatial and vertical agreement at line-crossing zones. A Python script was used to calculate the elevation differences at the intersection of crossing lines using an inverse distance-weighting equation. Elevation values at line crossings should not differ by more than the combined instrument-acquisition error values (per manufacturer specified accuracies, tables 1–3). Poor data quality can be attributed to GPS cycle slips, stormy weather conditions, and rough sea-surface conditions. If discrepancies that exceeded the acceptable error threshold were found, then the line in error was either statically adjusted or removed. A line in error indicates one or more of the following: (1) a segment where several crossings are incomparable, (2) a known equipment problem logged at the time of signal acquisition, or (3) faulty GPS data identified in post-processing. For this dataset, elevation differences at 3,352 crossings were within ± 0.30 m, which accounts for 99 percent of the crossings. Vertical TransformationIn addition to estimated uncertainties inherent for core datums (for example, NAD83, σ = 2.0 cm; NAVD88, σ = 5.0 cm; local mean sea level (LMSL), σ = 1.6 cm (National Oceanic and Atmospheric Administration, 2017)), error is introduced every time data are transformed between datums. The maximum cumulative uncertainty (MCU; quantified by standard deviation of the error) introduced when transforming from ellipsoid height (ITRF00) to orthometric height (NAVD88) to a tidal datum (MLLW) is 17.1 cm for the VDatum region listed as “Louisiana/Mississippi–Eastern Louisiana to Mississippi Sound” (National Oceanic and Atmospheric Administration, 2017; https://vdatum.noaa.gov/docs/est_uncertainties.html). NOAA reports the vertical error associated with each conversion performed in VDatum version 3.6; the vertical errors associated with the transformation of the Dauphin Island SBB data are presented in table 6.
Table 6.The National Oceanic and Atmospheric Administration (NOAA) VDatum version 3.6 vertical uncertainties reported for the datum transformations of the Dauphin Island, Alabama, single-beam bathymetry (SBB) datasets. The table lists the datum of input values, the datum of the transformed output, the area containing the input and output values, and the associated estimate of vertical uncertainty in centimeters (cm) for each area.
Digital Elevation ModelA comparison of the DEM versus the soundings (x,y,z point data) was performed to evaluate how well the DEM represented the original sounding data, quantitatively and spatially. The cell-node values of the DEM surface were compared with the final processed x,y,z point data using the Esri ArcGIS Spatial Analyst “Extract Values to Points” tool. The comparison produced a set of elevation differences between the gridded surface and the input data, from which the root mean square error (RMS) was calculated using the following equation:
There are a total of 4,493,114 soundings (x,y,z) in the NAD83 (CORS96) and NAVD88 GEOID12A dataset represented by the DEM; the RMS of all points is 1.13 m. The differences between the point dataset and the extracted DEM values were color-coded to allow a visual evaluation of differences (fig. 6). This comparison demonstrates how well the model surface represents the original sounding and sample data. In this dataset, hundreds of samples are often represented in a 50-m by 50-m cell; however, on the surface of the model, they are represented by a single cell value. Therefore, in cases where terrain slope is high, the gridding formula reduces the variability in the sample data (Foxgrover and others, 2004; Fregoso and others, 2008; Finlayson and others, 2011). This variability reduction is an output feature that allows for the display of continuous surfaces across bathymetric datasets where trackline spacing did not allow for overlap.
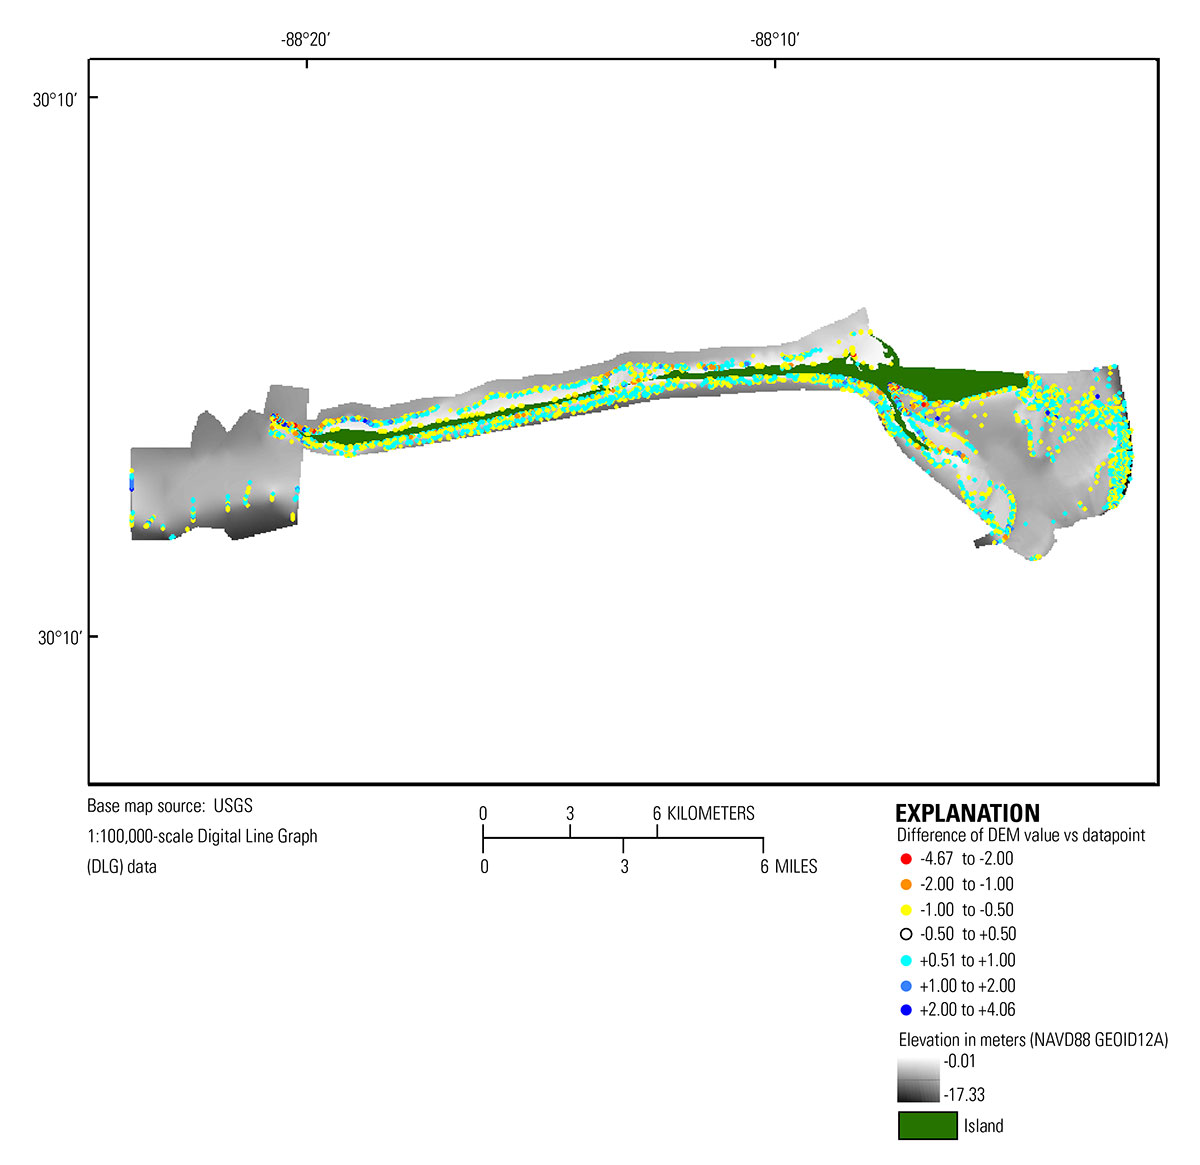 Figure 6. Map showing error values overlying the 50-meter (m) digital elevation model (DEM) referenced to North American Vertical Datum of 1983 Universal Transverse Mercator (UTM) Zone 16 North, and North American Vertical Datum 1988 (NAVD88) using the GEOID12A model. The colored circles represent the difference between the bathymetry grid and each sample point (for positive values, the grid is deeper than the soundings; for negative values, the grid is shallower than soundings). White circles represent an error of ± 0.50 meters. The island area extent is derived from the U.S. Geological Survey National Map light detection and ranging (lidar) data collected in 2015. [Click figure to enlarge] Note: Any use of trade names is for descriptive purposes only and does not imply endorsement by the U.S. Government. |

![]() U.S. Department of the Interior |
U.S. Geological Survey
U.S. Department of the Interior |
U.S. Geological Survey
URL: http://pubsdata.usgs.gov/pubs/ds/1095/ds1095_error-analysis.html
Page Contact Information: GS Pubs Web Contact
Page Last Modified: Tuesday, 02-Oct-2018 15:54:44 EDT
