 |
|
|
||||
| U.S. Geological Survey Data Series 344 |
Note: Bulleted subheading are links to other section pages that contain details about the collected data for each cruise.
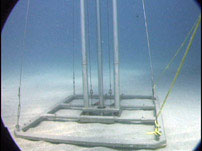
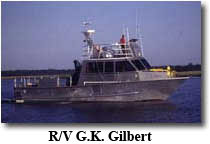
The USGS research vessel R/V G.K. Gilbert was used to position, deploy, and recover the vibracore system using a hydraulic crane. Once the rig is at the seafloor, the vibrating head is powered on to discharge a vibration that propagates through the aluminum barrel. The vibration displaces the sediment around the outside of the barrel, which allows the core to penetrate the sediment column. Upon recovery, the barrel is removed from the rig and cut to the top of the recovered sediment. The ends of the core sample barrel are capped and the core length measured. This measurement and other information about the core are recorded in a logbook. Further instruction on the construction, deployment, and overall vibracoring process can be seen in the downloadable QuickTime video available at https://pubs.usgs.gov/of/1998/of98-805/html/polloni3.htm
For more information about the core description and measurements, and other details about the logging method of the core, please refer to the section Core Description Sheet Process (below).
The vibracores from the 00SCC survey were opened and described by personnel at UNO. The procedure involved splitting each vibracore in half. One half was visually described using standard sediment logging methods and sampled at 1.0 ft (0.3 m) intervals for textural analysis. Additional samples were taken from the top and bottom of sand-rich intervals greater than approximately 2.0 ft (0.6 m) thick to allow for more effective textural classification of sedimentary units.
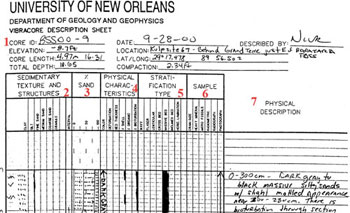
An example of a vibracore description sheet with explanation of each column is as follows:
1) Header information for the vibracore: Core ID, elevation, length, depth, acquisition date, location, compaction, and describer name.
2) Sedimentary Texture and Sedimentary Structures: Symbols representing sedimentary structures that are visible, such as shells, burrows, bedding, deformation, and other physical characteristics. A column also includes an estimated grain-size range downcore.
3) Percent Sand: This is a visual estimate of percent sand, silt and clay throughout the core from 0 to 100 percent.
4) Physical Characteristics: Includes descriptions on the color of the core sediments, deformation features, bedding thickness, and the estimated amount in percent (0-100%) of shells, organics, and bioturbation.
5) Stratification Type: Includes the bedding features apparent in the core, such as wavy, flaser, lenticular, cross bed (small/large), massive bedding, horizontal laminations, and so on.
6) Sample: These columns show the depth and type of sample taken for analysis. Some of these sample types include grain-size, heavy mineral, microfossil, radiometric, and whether a photograph or x-radiograph of the core was obtained.
7) Physical Description: Includes any additional information or interpretation of the core sediments.
Description sheets were scanned and saved as PDF files. Availability of vibracore description sheets for all surveys is provided in the Vibracore Description Sheets page. The hardcopy description sheets are archived at the UNO Coastal Research Laboratory. The remaining half of each split vibracore was cut into 3.28 ft (1.0 m) intervals, photographed in detail (see Photographs page), wrapped in plastic sleeves, and archived at the UNO Department of Geology and Geophysics Chevron core warehouse. The sampled halves (destroyed during sampling) of the vibracores were discarded.
A Penetrometer is a tool used to determine resistance and penetration into the sediment. The process measures barrel penetration over time to monitor full barrel deployment as an indicator of sediment compaction.
As mentioned briefly above, there is an electrical wire line attached to the top of the vibracore rig and connected to a computer on board the ship. On top of the rig the electrical wire is connected to a thin wire line that is wound on a spring-triggered spool housed in a waterproof casing. The thin wire is connected to the pneumatic vibrator that assists in allowing the core to cut into the sediment. As the vibracore barrel penetrates the sediments, the thin wire is unwound from the spool, turning a potentiometer within the housing which distributes increasing voltage to the voltmeter. The amount of electrical resistance displayed on the voltmeter is directly related to penetration of the barrel into the seafloor.
Voltage, depth comparison, and time are saved to an ASCII text file. These data are converted to a time verses depth graph. More information on which cores have this type of data can be found on the Grain-Size and Penetrometer Data page.
Grain Size refers to the diameter of individual grains of sedimentary or clastic rocks.
Textural analysis of sediment samples collected from the 00SCC and P86 vibracores was performed at the UNO Coastal Research Laboratory (UNOCRL) using a Beckman Coulter LS 200 particle-size analyzer; for data refer to the Grain-Size and Penetrometer Data page. The Beckman Coulter LS 200 particle-size analyzer is a state-of-the-art instrument that utilizes laser diffraction to measure the size distribution of sedimentary particles between 0.4 ![]() m and 2 mm. The utility of the LS 200 is the high reproducibility of measurements, rapid acquisition of results, ability to accurately and quickly provide quantitative measure of extremely small grain-size fractions, and customizable data output. Grain-size analyses were conducted by simulating the sizes that would be determined from standard ASTM 11-E sieves. Textural classification boundaries were based on the Wentworth (1922) size scale. Percent sand, silt, and clay for each sample are reported in a textural data table; depth versus sand graphs and grain size at cumulative frequency intervals of 5% between 0 and 100% are reported. Grain-size measurements were reported in mm and phi intervals for the mean and sorting, which are recommended as the statistical measures used in assessing the suitability of sediment for nourishment projects (USACE, 1977). The conversion of metric-based measures to the nondimensional phi (
m and 2 mm. The utility of the LS 200 is the high reproducibility of measurements, rapid acquisition of results, ability to accurately and quickly provide quantitative measure of extremely small grain-size fractions, and customizable data output. Grain-size analyses were conducted by simulating the sizes that would be determined from standard ASTM 11-E sieves. Textural classification boundaries were based on the Wentworth (1922) size scale. Percent sand, silt, and clay for each sample are reported in a textural data table; depth versus sand graphs and grain size at cumulative frequency intervals of 5% between 0 and 100% are reported. Grain-size measurements were reported in mm and phi intervals for the mean and sorting, which are recommended as the statistical measures used in assessing the suitability of sediment for nourishment projects (USACE, 1977). The conversion of metric-based measures to the nondimensional phi (![]() ) categories were completed using the equivalence:
) categories were completed using the equivalence:
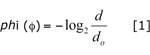
where: d = the millimeter diameter of the measured particle and do = a particle with a 1.0-mm diameter (Krumbein, 1938). In order to accurately establish a correspondence to grain-size data previously acquired by the UNOCRL the mean grain size (![]() ) was calculated using the relation:
) was calculated using the relation:

where: ![]() and
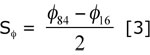
and ![]() represent the phi grain sizes for which 84% and 16% of the total sample are coarser. Sorting, a measure of the standard deviation (
represent the phi grain sizes for which 84% and 16% of the total sample are coarser. Sorting, a measure of the standard deviation (![]() ) from the mean grain size, was calculated through the equation:
) from the mean grain size, was calculated through the equation:
The interpretations from the core description sheets were digitized using a digitizing tablet, and the data were converted to an electronic spreadsheet format (Microsoft Excel, XLS) using a Visual Basic macro program. The two examples (below), show how the paper copy of the vibracore description sheets comply to a two-dimensional space-value format.
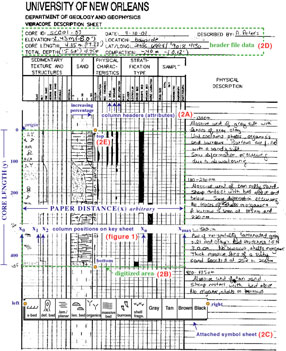
Figure Left: Example of a core description sheet showing column attributes (2A), area being digitized (2B), attached symbol menu (2C), header information (lat./long., elevations, and so on.) (2D), and locations of first four digitized points: top and bottom of core, and left and right side of symbol menu (2E). Columns are recognized by their distance from origin (x-value), and vertical dimension (y) is either core length or depth of core penetration relative to a datum. Attributes are digitized along their left outer edge.
Figure Below: Close-up example of a core description sheet showing different styles of attributes, such as symbols (4A), curves (4C), and text (4F). The orange dots represent digitized points.
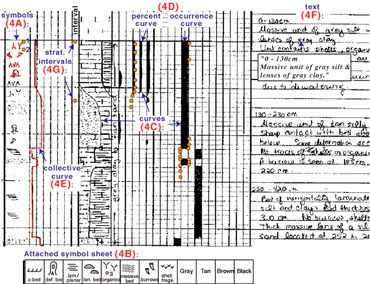
After the paper copy description sheet has been digitized, a conversion method captures all relevant attributes using a translation process that relates the position of an attribute in defined two-dimensional space to the value that the attribute represents. The relationship between position and data value is dependent on a key table that is customized to the type and format of data being converted.
The result is a spreadsheet-style output of the description sheet. The spreadsheet contains numerical and text information at user-specified intervals (for example, 2-cm intervals downcore). Some of the spreadsheets contain only the numerical and text data available (cruises CR83 and P86) as downloadable (XLS) files. Visit the Interpreted Vibracore Classification Profiles page for availability and method of accessing the files. The bss00_ cores were further processed using another translation process that relates a particular attribute to a customized key for further classification of the attributes as color and symbols. The color attributes represent sediment texture, graphicly displayed in the ternary diagram below. The further processed bss00_ cores are available for the Cruise 00SCC in the table on the Study Area Map.html as downloadable (XLS) files. Visit the Interpreted Vibracore Classification Profiles page for availability and method of accessing the files. These files contains tabs at the bottom of the spreadsheet.
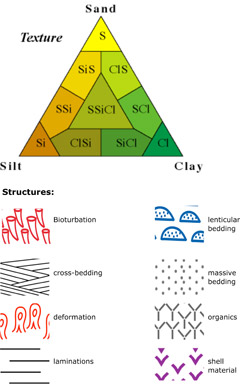
The "Legend" tab (figure left) contains the color coded Texture ternary diagram. This diagram is an equilateral triangle plot that depicts the ratios of three variables: sand, silt and clay (modified from Folk, 1968). The terminology is based on the combination of these variable end-members (such as a clay = Cl, silt = Si, and sand = S). An example of how to determine a ratio: ClSi (brownish-green), where the percentage of clay is less than silt and there is no or very little sand. These colors in this ternary diagram are represented for the Texture percent (Column G) on the “Data tab” spreadsheet.
Next in the Legend tab is the Structure icons (left). These symbols are represented in the Structure columns (R to AB) on the spreadsheet (Data tab). These attributes were digitized from the hand drawings usually found in the Clay column (see #2 in the Core Description Sheets figure). On the spreadsheet the symbols are located relative to depth and refer to physical and textural structures identified in the core during interpretation.
For a more detailed explanation of this process, please refer to Flocks (this volume) document located in the Software folder.
In order to fully penetrate deeper sand deposits correlated by HRSP and partially identified by the 20-ft (6.1-m) vibracores, 38 borings approximately 40 ft (12.2 m) deep were obtained in selected areas across the study area. These borings were taken with a Failing 1500 truck-mounted drill rig on a jack-up barge. The sampling procedure involved two techniques, one for clay strata, and one for sand strata. When in clay, a 3-in (0.76-m) diameter, 4.0-ft (1.2-m) Shelby tube was driven 3.5 ft (1.1 m) with a 1.5-ft (0.5-m) washout between drives. The 3.5-ft (1.1-m) samples were extruded and logged in the field. When sand was encountered, either in the sample or seen in the cuttings during washout, the sample technique was changed to driving a 3-in (0.76-m) split-spoon sampler 1.5 ft (0.5 m) with a 1.0-ft (0.3-m) washout between samples. The split-spoon samples were also logged in the field.
Representative samples of the clay and sand from each drive were jarred and delivered to the USACE–New Orleans with the field logs. The field log data were imported into the USACE BORPLOT program, which allows the boring data to be viewed and plotted graphically. Representative sand samples from each sand strata identified on the logs were submitted to UNO for grain-size analysis (Kindinger and others, 2001).
Availability of borehole description sheets, and grain-size data are provided in the USACE EUSTIS page.
NOTE: PDF files may be viewed using free Adobe Reader software.

![]() U.S. Department of the Interior |
U.S. Geological Survey
U.S. Department of the Interior |
U.S. Geological Survey
URL: https://pubsdata.usgs.gov/pubs/ds/344/html/methods.html
Page Contact Information: Publications Team
Page Last Modified: Monday, 28-Nov-2016 13:00:57 EST