ERROR ANALYSIS
Grid Error
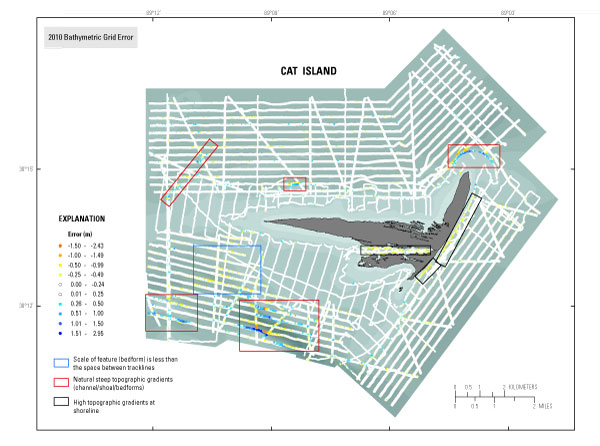
Before gridding, all soundings (swath and single beam combined) were classified in 0.25-m intervals and color coded to ensure that no data visually stood out, and after gridding, each grid was visually scanned to identify noticeable outliers (areas of "potholes" in grid which represent obvious issues with data). Additionally, the final grid values were compared to the original soundings by using the “extract values to points” tool within the Spatial Analyst tool of ESRI ArcGIS version 10.0.2. This comparison allowed analysis of how well the surface represented the original sounding data. The root mean square error of all points is 0.141 m. The root mean square error of 94 percent of all points is 0.075 m. The error for all soundings is higher because the gridding algorithm had difficulty with steep gradients (channel and northern spit area) and bedforms that could not be resolved by the gridding algorithm. The algorithm was constrained by the 50-m grid cell size and the distance between tracklines was approximately 300 m (fig. 7). The bedform example was especially evident for the area shown within the blue box in figure 7. There are known closely spaced linear bedforms in this area described by Buster and Morton (2011) that were not resolvable with the trackline spacing of this survey. Finlayson and others (2011), Fregoso and others (2008), and Foxgrover and others (2004) also reported difficulty with gridding steep slopes. Percent coverage of swath data relative to grid area is 22 percent.

Figure 7. Error values representing the difference between the bathymetry grid and each sounding point (positive values – grid is deeper than soundings; negative values – grid is shallower than soundings). White symbols represent error of +/- 0.25 centimeters and the background is the gridded bathymetry data. [Click to enlarge.] Abbreviation: m, meter.

