SURVEY PRODUCTS
BATHYMETRY
|
|
SIDE-SCAN SONAR
|
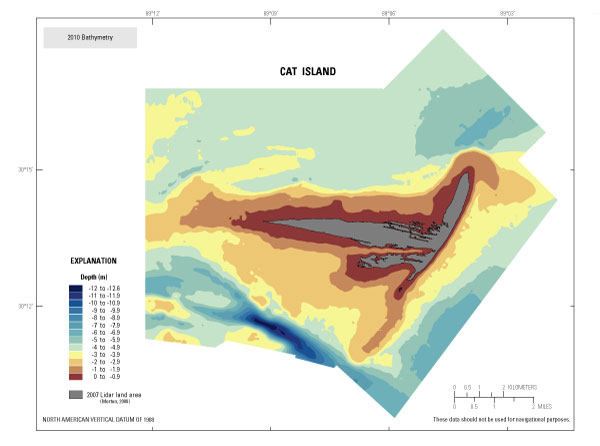
Figure 8. Integrated swath and single-beam bathymetry of Cat Island, Mississippi from 2010 with 2007 lidar-derived shoreline. [Click to enlarge.] Abbreviation: m, meter.
|
|
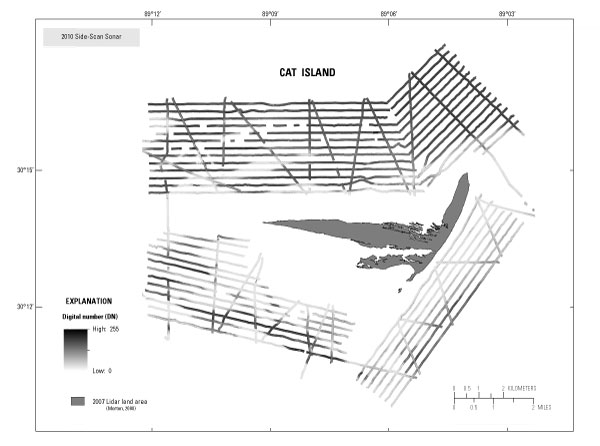 Figure 11. Digital raster image of a processed acoustic backscatter data mosaic with acoustic amplitude represented by 8-bit digital number pixel intensity (0 - 255). Lighter tones (high-amplitude return) represent smoother and harder seafloor surface material, while the darker tones (low-amplitude return) indicate less dense surface material and coarse surfaces.
|
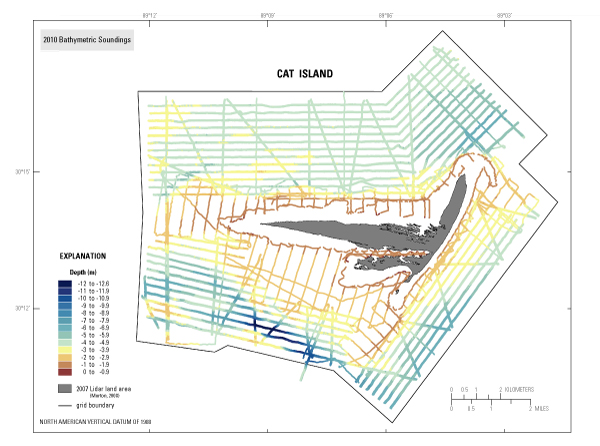 Figure 9. Swath and single-beam bathymetry soundings and grid boundary with 2007 lidar-derived shoreline. [Click to enlarge.] Abbreviation: m, meter.
|
|
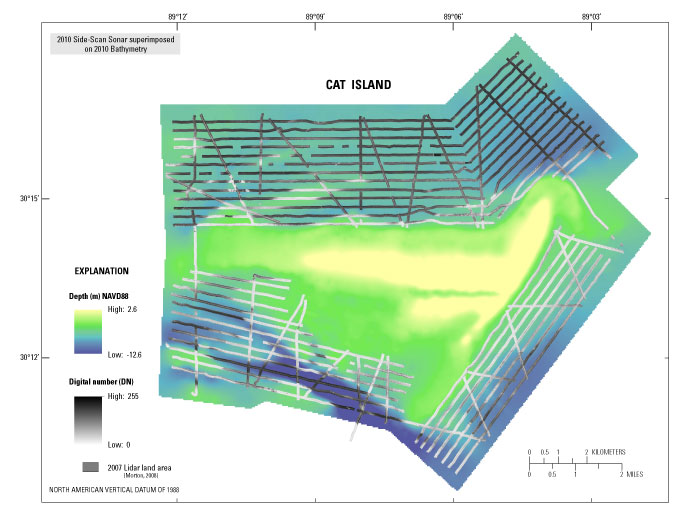
Figure 12. Acoustic backscatter data superimposed upon bathymetry grid. [Click to enlarge.] Abbreviation: m, meter.
|
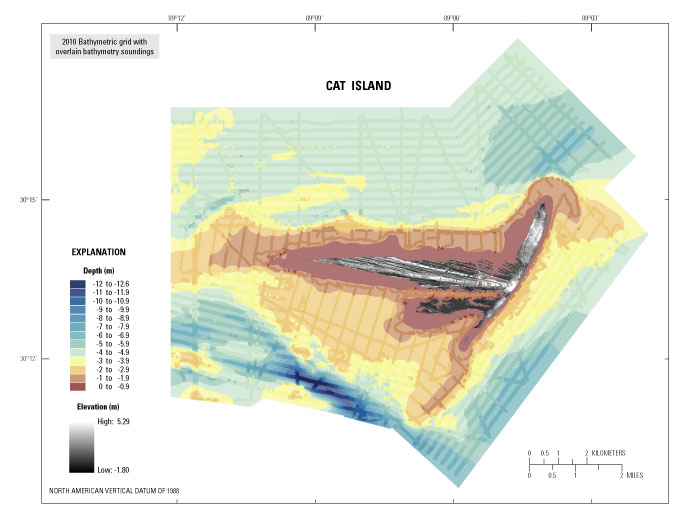 Figure 10. Integrated swath and single-beam bathymetry grid overlain with soundings used to create the grid with 2007 lidar-derived shoreline. This figure shows how well the gridding algorithm is gridding the actual areas where there are soundings (22 percent coverage) even though the finer-detailed bedforms are not represented well. [Click to enlarge.] Abbreviation: m, meter.
|