U.S. Geological Survey Data Series 761
Click on an inset map to view the area in greater detail.
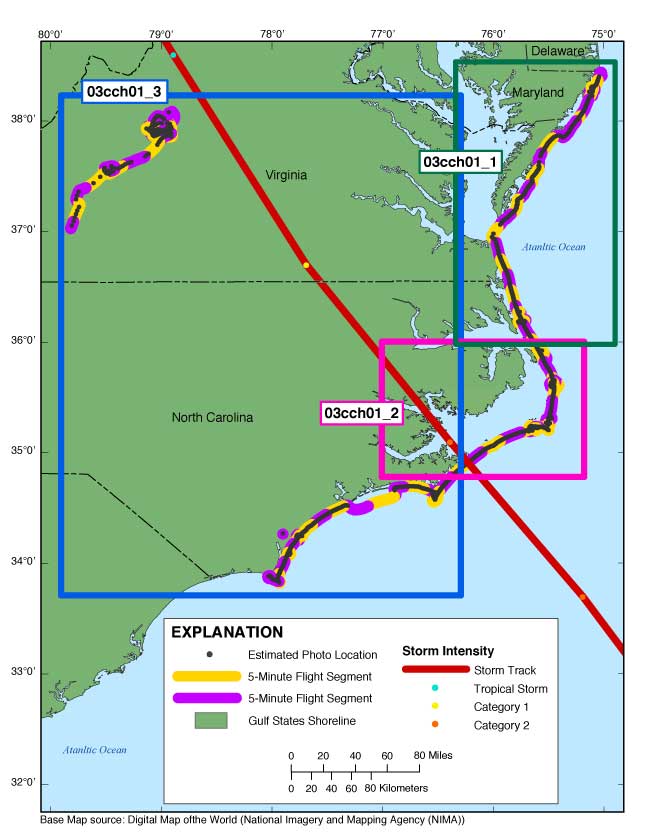
| Figure 1. Map showing the post-Hurricane Isabel oblique aerial photograph survey (USGS field activity 03CCH01). The flightpath is represented by a purple and yellow colored line, the photographs by the gray dots along the flightpath, the storm track is a red line (provided by NOAA), and the storm strength is indicated by blue, yellow, and orange dots, based on the Saffir-Simpson Hurricane Wind Scale (Saffir, 1973; Simpson, 1974). The region boxes link to a more detailed map of the area. The region boxes also exhibit how the full-size photographs are divided on the discs: 03cch01_1 Area Map (Disc 1), 03cch01_2 Area Map (Disc 2), 03cch01_3 Area Map (Disc 3) (Internet version contains all photographs). |

![]() U.S. Department of the Interior |
U.S. Geological Survey
U.S. Department of the Interior |
U.S. Geological Survey
URL: http://pubsdata.usgs.gov/pubs/ds/761/pubs761/html/all.html
Page Contact Information: GS Pubs Web Contact
Page Last Modified: Monday, 28-Nov-2016 19:11:21 EST
