by
Morgan, B.A., Wieczorek, G.F., Campbell, R.H., and Gori, P.L.
OPEN FILE REPORT 97-438
1997
|
|
|
|
A severe storm on June 27, 1995 triggered hundreds of rock, debris and soil slides from the steep hillsides of Madison County, Virginia. Most of these transformed into debris flows that inundated areas downslope causing damage to structures, roads, utilities, livestock and crops. This report contains an analysis of areas susceptible to debris flows including an examination of source areas, channels and areas of deposition. These analyses are used to develop a methodology for identifying areas subject to debris-flow hazards in Madison County. The report concludes with a discussion of strategies for reducing debris-flow hazards and the long term risk of these hazards in Madison County as well as for similar areas along the eastern flank of the Blue Ridge.
On June 27, 1995, an unusually severe storm wreaked havoc on a small area of about 50 square miles in Madison County, Virginia. During a period of about 16 hours, as much as 30 inches of rain fell in the area of maximum storm intensity and probably about 25 inches fell within a five-hour period over small areas. The location of this area together with data on the regional distribution of rainfall is shown in Figure 1. The result of this extreme rainfall event was mass wasting of steep hillslopes in the form of soil slides and slumps, rock slides, and numerous debris flows, with downstream flooding and with consequent destruction of houses, roads, utilities, livestock, and crops. A general description of landslide and debris-flow hazards caused by the storm was reported by Wieczorek and others (1995) and a preliminary inventory of the extent of debris-flow and flooding effects in the area was reported by Wieczorek and others (1996). The latter report includes a map of debris flows, flooded areas, and plots of storm cell centers at a scale of 1:24,000. The data presented in those reports combined with information from additional field investigations are used to provide an analysis of potential future hazards from landslides in the Madison County area. A hazard analysis requires cartographic representations of the location of potential failures and estimates of the recurrence interval for events of a similar magnitude. Although these investigations are confined to one storm event within a relatively small region, the method of hazard analysis and suggestions for mitigation of the effects of ground failures in this area have a wide applicability for residents along the eastern slopes of the Blue Ridge and Appalachian Mountains from Pennsylvania to Georgia, an area of over 160,000 square miles.
The Madison County area affected by the June 27, 1995 storm is within the upper drainage basin of the Rapidan River on the eastern flank of the Blue Ridge mountains. The topography is irregular with many subsidiary ridges extending several miles away from the Blue Ridge separating well defined hollows with small tributaries. Figure 2 is a digital shaded relief map of the area with isohyets from the storm shown in red. The maximum 30 inch isohyet is centered over the small community of Graves Mill.
The geology of Madison County was mapped and described by Allen (1963). More recent summaries of the geology of the underlying rocks have been published by Gathright (1976) and by Rader and Evans (1993). The area affected by the June 27 storm is underlain by quartzo-feldspathic rocks of mostly granitic composition. These rocks originated as igneous intrusions and were deformed and recrystallized during the Grenville orogeny, about 1 billion years ago. These rocks were intruded by diabase dikes which presumably acted as conduits for the volcanic flows of the Catoctin formation which erupted about 570 million years ago and which outcrops to the west along the summit of the Blue Ridge. All of the rocks were altered more recently by metamorphism and deformation during the Paleozoic Era. The effects of the later deformation are mostly confined to a few well-defined faults and shear zones that cut through the bedrock of the region.
The rainfall-triggered debris flows that contributed to the June, 1995, natural disaster in Madison County, Virginia, were not unique events. Similar events cause one or more disasters of equivalent or greater magnitude somewhere in the world every year. Notable recent disasters from rainfall-triggered debris flows have occurred in Italy (Bandis and others, 1996; Pollini and others, 1996), Phillipines (Pierson, 1992), Japan (Sasahara and Tsunaki, 1994), Hong Kong (Brand, 1993, 1994), Nepal (Yoshimatsu, 1994), Puerto Rico (Jibson, 1989; Larsen and Torres Sanchez, 1992), Brazil (Ogura and Filho, 1991), Thailand (Degraff, 1990), Hawaii (Reid and others, 1991) and southern California (Harp and others, 1995). These kinds of landslides have been responsible for many deaths and injuries. Reports of these disasters often include associated flooding and deaths from drowning. There is a substantial and growing scientific understanding of these events, including the conditions that trigger them, the processes that model their behavior, existing and potential remedial measures, and procedures for forecasting, warning, and emergency response (Wieczorek, 1993). Geologic evidence supplements historic reports to indicate that there is a significant potential for events like these to occur wherever there are steep hillside slopes blanketed by a relatively continuous, generally thin cover of colluvial and residual soil, and whenever they are subjected to storms that produce prolonged rainfall of high intensities. Although the minimum rainfall intensity and duration needed to trigger these events varies from region to region, the general conditions can be identified and storm forecasts can often predict times of enhanced danger within a few hours (Campbell and others, 1989).
Surficial deposits, exposed in debris-flow channels scoured by extensive runoff during the June 27 storm in Madison County, provide evidence that the area has been subjected to repeated episodes of debris-flow activity. The preliminary map of debris flows in Wieczorek and others (1996) plots the source or initiation points of about 550 slides which coalesced into several hundred debris-flow channels or chutes. After failure, continued rainfall further eroded the chutes forming deeper channels and plunge pools, as much as 20 feet deep. The erosion exposed soil, colluvium, saprolite and bedrock. Exposures of the older colluvium display a rich history of fossil soils, gley horizons with abundant organic remains, and deposits of prehistoric debris flows. In most locations the older debris is only moderately weathered; in some localities, however, the weathering and rubification of coarse debris and matrix is extreme resulting in saprolite.
A systematic study of the older deposits and especially an interpretation of the ages of the deposits is beyond the scope of this report. There is no historic record or suggestion of debris-flow activity in the Madison County area which was first settled in the early 18th century. Severe floods in the county occurred in April 1937, October 1942, and June 1972 (Orange County Review, 7/6/95) as well as in September 1996 without triggering debris flows. No detectible scars from landslides or debris flows could be found on aerial photographs of the area. Preliminary carbon-14 dates from deposits of prehistoric debris flows give ages from 2,000 years to greater than 50,000 years bp. These data suggest that the recurrence interval for debris-flow events in the Madison area is approximately 2,000 years (L.S. Eaton, U.Va., oral communication, 1997). However, interpretation of these ages is quite difficult because of the complexity of the debris-flow channel and fan depositional environments. Shallow channels are easily blocked by boulders causing subsequent flows to migrate across the slope. The resulting stratigraphy may include only a subset of the events that took place at a given site and can be amazingly complicated, especially as distinctive marker beds are generally absent. During a single event, debris flows may be numerous in an area but not enter the channel being investigated; or debris flows may have travelled through the channel without deposition; or debris flows may have scoured out older deposits, removing the evidence of older activity; or the debris flows my recycle and mix debris of multiple origins. Inferences on the recurrence of debris flows in the area are affected by these uncertainties. More reliable inferences must be based on area-wide patterns of dates as well as multiple dates from single channels. At present it can be said with some confidence that debris-flow activity in the area extends back well before the Holocene and that many of the flows took place in a cold climate environment.
Debris-flow materials that were not deposited onto fans on the lower slopes entered directly into flooding streams and were removed by flood waters. Fans of debris-flow materials are preserved as composite aggradational landforms that are conspicuous on 1:24,000 scale topographic maps. The landforms are easily identified because of the lower gradient topography which is incised by many small intermittent drainages. Many of the channels crossing the fans were deepened by erosive action of stream flow as rainfall continued during the June 27 storm. The fans reveal a complex history of deposition, bypassing, and scouring which add to the difficulty of interpretation of the regional history of erosion and deposition. Near Graves Mill, at least three older episodes of debris-flows are exposed. Despite the physiographic prominence and evidence for multiple events, most fans are thin. Bedrock is often exposed in gullies and the fans rarely are more than several tens of feet thick. Most fans have been modified by stream or river action removing fine-grained matrix material from the toe of the fan.
The stratigraphy of debris-flow deposits in nearby Nelson County, Virginia, has been described by Williams and Guy (1973) and Kochel (l987). Nelson County, like Madison County, is on the eastern flank of the Blue Ridge and the area was subjected to catastrophic debris flows with the passage of Hurricane Camille in 1969. In a detailed study, Kochel and Johnson (l984) concluded that at least two prehistoric episodes of activity preceded the 1969 event; these are summarized by Kochel (l987) as being at 6,340 and 10,500 years bp, the older material lying directly on bedrock. From this, he deduced an average recurrence interval of approximately 3,000 to 4,000 years at this site. A notable difference between the Nelson and Madison areas is that in Nelson County the prehistoric debris flows are Holocene (less than 10,000 bp), whereas the Madison County prehistoric debris flows occurred in both the Holocene and Late Pleistocene.
Clark (l987) documented historical debris-slide and debris-flow events in the southern Appalachians. He lists 51 events occurring between 1844 and 1984, or about one event in the area every 2.7 years. The early record is problematic however, because the region was sparsely populated and reports of events during much of the early period were most probably made only if human activity was affected.
Despite the catastrophic nature of the June 1995 storm and the absence of any historical knowledge of an event of such severity in the Madison County area, debris flows must be considered as natural, recurring processes affecting the long-term evolution of the landscape. The long continued erosional activity of the Blue Ridge and of the greater Appalachian region has not permitted the development of large aggradational landforms. Much of the history of erosion of the region including debris-flow events has been lost.
Most debris flows initiate as shallow landslides (soil, debris or rock slides) on steep slopes with relatively thin residual or colluvial soils. Slope steepness influences the susceptibility of hillslopes to initial sliding because of the limited strength of soils, particularly under saturated conditions during heavy rainfall. As described by Wieczorek and others (1996), most of the shallow landslides during the 1995 storm rapidly changed into debris flows which moved down preexisting channels onto fans as the slopes declined from about 30 degrees to about 6 degrees. Measurements of debris-flow source areas, channels and deposits on fans are listed in Table 1a, Table1b and Table1c, and are keyed to a map showing these features on Plate 1.
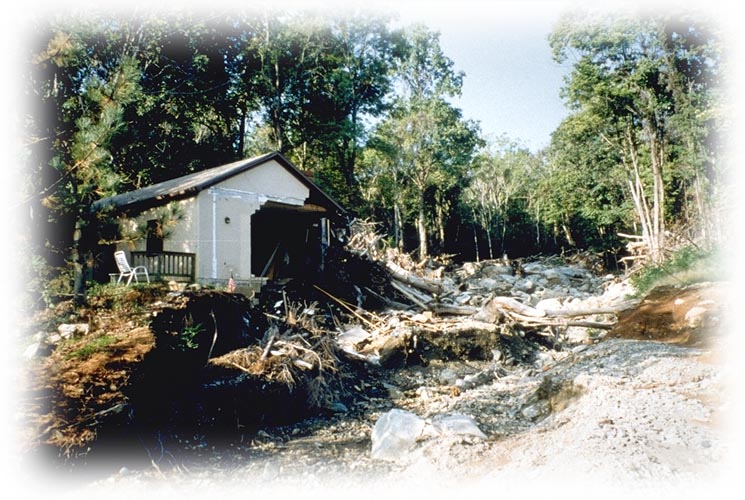
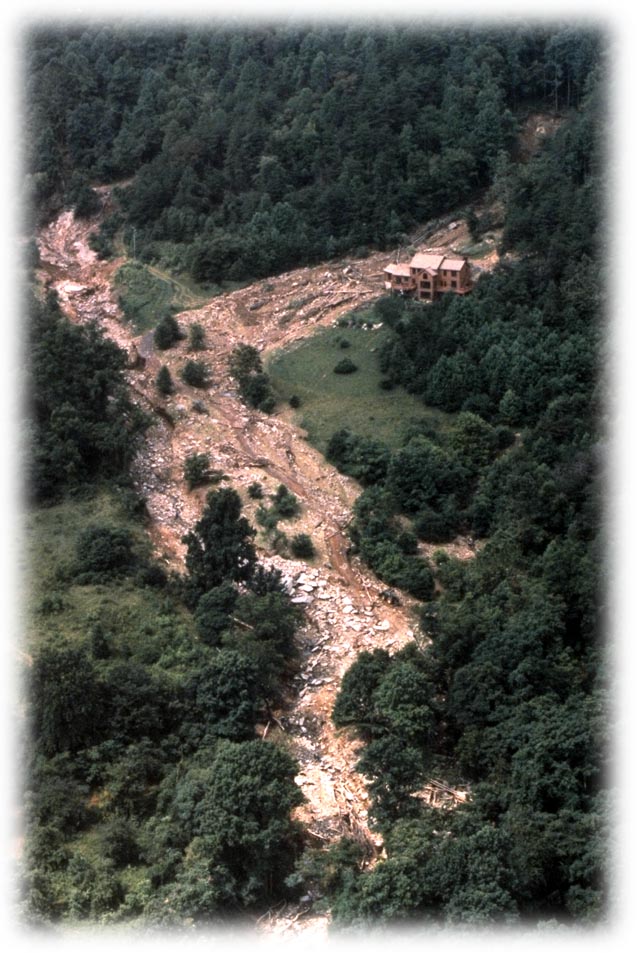
Debris flows are capable of exerting tremendous lateral forces on objects in the flow path, particularly from the impact of entrained, large boulders. Impact pressure from a debris-flow front is proportional to the square of the velocity (Watanabe and Ikeya, 1981). The velocities of debris flows in Madison County ranged from about 20 mph (29 ft/sec) according to eyewitness accounts to as great as 50 mph (73 ft/sec) from calculations of mean velocity based on superelevation along bends or curves in the channel. Direct measurements of debris-flow velocity are rare; however, values as great as about 30 mph (44 ft/sec) have been measured (Costa, 1984, p. 302). Few structures can withstand the impact of rapidly moving debris flows or the boulders within the flows. The one fatality during the June 27, 1995 storm took place near Sag Top, about two miles northeast of Graves Mill. The fatality resulted from a debris flow in a steep channel hitting, crushing, and carrying away a house with its occupant. A house near Graves Mill was also moved by a debris flow, but the impact force was probably much less because of a lower velocity on the flatter fan surface.
In Madison County impact forces imparted by high velocity flows snapped off trees up to several feet in diameter at their base. A large amount of timber was removed from hillsides and channels by debris flows. Tree trunks became incorporated into the debris flows, adding significantly to their volumes. The larger debris flows removed virtually all trees in their path starting from the source areas high on the mountains and continuing down through the channels and onto the fans. Farther out on the fans where flow depth was shallow and velocities decreased, some trees remained standing. At constrictions, trunks in the flows piled up against standing trees, large boulders, structures or bridges creating logjams or blockages. Most often flow was diverted around these blockages, thus shifting the hazard to areas adjacent to the channel or to a different part of the fan. Some trunks were deposited along with large boulders and other debris on the fans. Many trunks were carried away by flood waters into the main streams and rivers because of their buoyancy. Virtually all trunks were de-barked and stripped of limbs and canopy.
Multiple pulses of debris flows were observed in several channels and fans. Near Graves Mill a house was hit and moved by separate debris flows about 1.5 hours apart (Mr. Randall Lillard, oral commun., 8/28/95). An observer east of Graves Mill observed five surges of debris flows moving down a single channel with an estimated velocity of 20 miles per hour about fifteen minutes apart (Mr. Leighton Brown, oral commun., 10/10/95). The unknown amount of time between multiple pulses of debris flows in a channel poses hazards for escape and rescue.
Once a debris flow emerges from a channel, the problem of determining its path across a fan becomes complicated by the ability of the flow to erode, to spread, to plug, and to alter its direction. The rate of volume transport (ft3/sec) of a debris flow and its change with time, viscosity, and fan topography are some factors important for debris-flow runout and deposition on fans. Using data from individual events elsewhere, two-dimensional mathematical models for flows on fans have been calibrated to determine flow depths, velocities, impact forces and areas of deposition (Mizuyama and others, 1987; Mizuyama and Ishikawa, 1990; O'Brien and Fullerton, 1990; Takahashi, 1991). These methods require a large amount of data along with numerous assumptions about the characteristics of the debris flow. Conducting such analyses for each of the numerous drainages of Madison County was not feasible; a different procedure for identifying hazards is described in a subsequent section.
In Madison County most debris-flow fronts in channels ranged from 3 to 10 feet high, but in a few channels the fronts exceeded 15 feet. The height of debris-flow fronts was determined from the elevation of deposits, mud lines, and damaged vegetation above the orginal channel bed. Generally, flows on slopes of more than 12 degrees were erosive. Flows that began initially as landslides of several hundred cubic yards increased many times in volume as they travelled down steep channels. The landslide sources accounted for only about 10% of the total volume of the largest flow deposit near Kinsey Run, about 1.5 miles from its source.
Debris-flow deposition generally occurred on slopes flatter than 10 degrees. Boulders up to 16 feet in length were carried and deposited by flows in these flatter areas. The height of the flow front generally decreased as the debris flow emerged from the channel and spread across a wide, unconfining fan. Although the determination of flow depth on the depositional fan is a complex problem, the flow fronts or thicknesses of deposits on fans seldom exceeded 10 feet, and more commonly deposits were from 3- to 6-feet thick.
The identification of potential hazards from debris flows in Madison County is based on field observations of the bedrock and surficial geology, on the terrain aspects of the debris flows and by the description and data on areas prone to debris-flow events presented in the previous section.
In Madison County, bedrock lithology had little or no influence on locations of either the failure sites or the channels of the debris flows produced by the June 27 storm. The underlying granitic rocks were recrystallized in the Grenville orogeny about one billion years bp. The rocks are either massive or layered, but do not break easily along well defined foliations. Nearly vertical dikes of metadiabase intrude the granitic rocks and are altered to greenstone. Sparse zones of shearing and faulting strike northeast and dip to the southeast. There is no obvious preferred direction of rock slides or soil slips related to these rock types nor to the local foliations in these rocks. Failures that generate debris flows, as previously described, are usually shallow soil slips or slides of colluvium over bedrock, and only rarely involve bedrock or saprolite.
Although bedrock lithology did not appear to influence the initiation of debris flows, the granitic composition of the bedrock provided an abundance of quartz sand in the soil and weathered colluvium. Coarse-grained materials (gravel and sand-sized-particles) are much more abundant than fine-grained materials (silt and clay) in the matrix of the depositional fans of the debris flows. Figure 3A shows the distribution of grain sizes in a composite of ten samples of matrix all taken from fans in the Graves Mill area. The percentage of fines (silt and clay) in the matrix of Madison County debris flows was determined by mechanical analyses to generally range from 8 to 14%; this is lower than the 10-20 percentage from many debris flows worldwide (Costa, 1984). The clay-sized fraction of the Madison County samples ranged only from 2-3%, which is in the lower range of values commonly reported for debris flows. Because the clay reduces permeability, prevents rapid dissipation of pore pressure, and greatly increases mobility, the mobility of debris flows is highly dependent on the presence of even 1-2% clay in the slurry (Costa, 1984). The debris flows of Madison County did not travel more than 1-1.5 miles partly because of the low clay content of the matrix. Figure 3B shows the distribution of grain sizes in a composite of eighteen samples all taken from source areas of debris flows in the Graves Mill area. These samples of percentage of fines (silt and clay) range from about 7-50%. The much higher percentage of fines from source areas reflects the origin of debris flows as soil slips on colluvium or weathered bedrock. The clay-rich soils, forming the initial matrix of the debris flows, were rapidly diluted down slope as the debris flows swept deeper and deeper through the surficial materials, well below the clay-rich A horizon of the soil.
Topographic aspect appears to have had little or no influence on the sites of debris flows, debris slides or rock slides. The propagation of the June 27 storm across the area and its inability to move into the higher parts of the Blue Ridge have been documented by Smith and others (l996) and shown cartographically by Wieczorek and others (l996) and in this report (Plate 1). Ground failures occurred along the track of the storm and the principal debris-flow channels followed existing drainages. Debris flows did not preferentially exploit any set of drainages with a preferred orientation.
All of the debris flows were generated in areas with forest cover. Although no systematic study of the forest ecology was made (see Hack and Goodlett, 1960), there is no obvious correlation between either forest health or stage of growth. Areas affected by gypsy moth infestations are not preferentially affected by debris flows, nor do they contribute a substantial increase in trees and other organic debris to the flows. The study area was extensively logged from 1880 to about 1920 and most of the present forest stands appear to be about 70 years old. Areas that have undergone extensive and recent logging are not the sites of increased ground failures.
Although the literature contains numerous references to ground failures in the southern Appalachian area which are localized in hollows or swales containing thick colluvium, (see for example, Kochel, 1987; Clark, 1987), hollows do not provide a useful predictive guide to the location where ground failures initiated in the Madison area. Many hollows or swales did not fail during the June 27 storm, and many failures occurred on slopes with negligible swales. All failures that devolved into debris flows moved rapidly from the point of origin into first- and second-order drainages usually within several tens of feet.
The most critical factors influencing the site of landslides and consequent hazards are the amount and intensity of precipitation falling within a given area, steep hill slopes and preexisting stream channels draining steep slopes.
Table 2 gives data on rainfall reported by residents in the Madison area. Measurements of rainfall during and immediately after such an extreme event have a wide range in accuracy. Three measurements within a small area near Graves Mill equal or slightly exceed 30 inches during a period of about 16 hours. These three measurements establish a reliable maximum for the rainfall. A few measurements are minimums because of rain gage overflow. Buckets and ice chests, left open during the storm, were measured and calibrated later for total rainfall. From these a fairly consistent picture emerges of an earlier storm during the night between 2 and 6 am which produced as much as 5 inches of rain and a second storm between 10 am and 3 pm which produced up to 25.5 inches of rain. Plate 1 shows contours of storm rainfall totals derived from measurements taken in this and surrounding areas. The locations of these measurements are shown on Plate 1 and are listed in Table 2. Also plotted on Plate 1 is the approximate time and track of the second principal storm as well as of three eyewitness accounts of the time of debris-flow activity. From these reports, it is clear that debris-flow activity began while the storm was in progress, well before the total rainfall had accumulated. Clearly, critical factors for rainfall to initiate debris-flow activity must include both the intensity and duration of rain falling on a surface that may have been nearly saturated with water. Significant amounts of rain had fallen throughout the Blue Ridge mountains during the preceding week, substantially increasing soil moisture. In the June 27 storm, intensity of rain may have exceeded 5 inches per hour in several locations, and may have persisted at that rate for more than 2 hours.
Intense rainfall resulting in high pore water pressures in thin soils was probably a major factor in triggering soil slips and landslides as discussed by Campbell (1975). A series of landslides were observed where springs created high pore water pressures in soils over bedrock. The high water pressure weakened the soils, induced small displacements, and caused small areas of soil to liquefy, lose all strength, and flow down the hillside. These multiple failures are sometimes referred to as blowouts, and leave sharp spoon-shaped scars on the hillside (Hack and Goodlet, 1960). The data in (Table 1a, Table 1b, and Table 1c) show that failures occurred on colluvium mantled slopes with an average slope steepness of 30 degrees (67 percent grade). That average angle is tightly constrained with both mean and mode equalling thirty degrees and a standard deviation of only 3.5 degrees. Thirty degrees probably approximates the maximum stable slope attainable under present climatic conditions for a colluvium mantled slope; steeper slopes in the area usually have outcrops of bedrock and only rarely attain values greater than 45 degrees.
A generalized hazard map for the Madison County area is presented as Plate 2. Identification of the potential for hazards is based on the following criteria:
Areas traversed by debris flows and floods in June, 1995, are taken from Plate 1. The extent of alluvial sediments defining the existing flood plain, and areas underlain by prehistoric debris-flow deposits were determined by inspection of 1:24,000-scale topographic maps and by field observations.
Plate 2 uses colors to depict slope values. Slope, aspect, and elevation were derived for 10-meter grid cells from a digital terrain model created from standard USGS digital line graph (DLG) data for the contours of the 7.5' quadrangles included in the study area. The 10-meter cell size is probably as small as one can expect to accurately use for a representation of the terrain from these contour maps. Of course, features 10 meters in size or smaller cannot be resolved by the terrain data. Moreover, slope angles derived from these data are less accurate where slopes are generally low (particularly for slopes less than about 10 degrees). For ease of map display, cells of similar slope have been grouped together in five intervals (less than 14 degrees, 14 - 26 degrees, 26 - 34 degrees, 34 - 45 degrees, and greater than 45 degrees). The slope intervals and their relations to debris flows in other parts of the U.S. have been described and discussed by Campbell and others (1989). The interval of slopes of 26 - 34 degrees identifies the rounded limits within the standard deviation for measured slopes containing the initial ground failures in the Madison County area. The color bands showing these and steeper slope intervals identify areas with a high susceptibility for generating future ground failures under the conditions of a severe storm similar to that of June 27, 1995.
Active and intermittent stream channels draining slopes steeper than 26 degrees constitute the principal pathways for debris flows and therefore provide a guide for predictions of the transport of future ground failures and debris flows. Plate 2 shows the areas defined by the stream channels draining these steeper slopes. All potential stream pathways are delineated with a buffer point of origin, down slope to the terminus of the debris flow fan or its intersection with flood waters within a higher order drainage. The potential pathways show the results of modeling the lateral extent that would be occupied if a debris-flow front 10 feet high moved through existing drainage channels or potential drainage channels below areas where slopes are steep enough for debris flows to be initiated by high rainfall. The 10-foot flow depth represents the average of the estimated depths for flows in the channels observed in the field. Actual and potential flow paths were derived by using ARC/INFO GRID functions designed for use in hydrologic modeling. The elevation grid provided a principal basis for deriving grids representing flow directions, flow accumulation, stream lines and stream order, which were utilized to delineate the areas of potential debris-flow hazard.
The data shown on Plate 2 at 1:24,000-scale are not sufficiently detailed for the results of these analyses to be directly applied to specific site evaluations. The results should serve, however, to identify areas where state and county officials may wish to adopt and implement grading code measures (such as those outlined in Chapter 70 of the Uniform Building Code) for the protection of inhabitants of the county. It should also help to serve emergency response officials to identify areas likely to have the greatest need for services when National Weather Service (NWS) forecasts warn that extreme rainfall events are imminent. The procedures used to make the map are probably valid for application to other parts of the Blue Ridge, and for most other parts of the southern and central Appalachian Mountains where digital line graph data for the contours of USGS 1/24,000-scale 7.5' topographic maps are available.
Debris-flow hazards exist naturally along much of the Blue Ridge Mountains. These hazards pose a risk to citizens, livestock, buildings, highways, and bridges. Although time intervals as long as several thousand years may pass between successive episodes of debris flows in a specific drainage basin, significant numbers of Blue Ridge drainage basins are affected by debris flows every 2 - 5 years. The hazards can be avoided or the potential for damage mitigated through structural and non-structural methods.
Present land use in Madison County is predominantly rural and agricultural, but development pressure from the expanding Washington D.C. and Charlottesville areas is likely to increase population in the next several decades. Few structural methods, for reducing potential debris-flow damage (e.g. debris basins), would currently be a cost-effective means for reducing potential debris-flow damage because of the relatively low value of structures, property, etc., at risk and the relatively low frequency of such events at a given site. However, plans for residential developments or other higher population density land uses could include consideration of debris basins and barriers.
With future growth, various non-structural methods, such as zoning and grading ordinances, as well as structural methods, would have to be analyzed in terms of being cost-effective alternatives. Zoning and grading ordinances to avoid building in areas of potential hazard or to regulate construction to minimize potential for landsliding is one non-structural method to reduce the likely consequences of debris flows. For example, Loudoun County, Virginia, has adopted a zoning ordinance preventing the development of building sites with steep slopes along the Blue Ridge (defined in the ordinance as exceeding a 15 per cent grade, equivalent to an 8 degree slope) which substantially reduces the hazards of landslides and debris flows within that area. The development of excavation and grading ordinances, e.g. Chapter 70 of the Uniform Building Code, has drastically reduced the cost of landslide damage in southern California and elsewhere (Schuster and Kockelman, 1996).
For existing (or future) structures in hazardous areas, obtaining flood insurance through the National Flood Insurance Program (NFIP)is another non-structural means of limiting losses due to debris flows. An amendment to the NFIP extended the coverage to mudslides, even though the range of phenomenon covered by the term "mudslides" has not been consistently interpreted in all parts of the country. As worded the standard flood insurance policy includes "mudslide" (i.e., mudflow) and excludes "landslides". Coverage under NFIP has usually been interpreted to include the damaging effects of debris flows in California, but conflicting interpretations have been applied in some other areas.
Warning systems are another non-structural approach to mitigation. Installation of a debris-flow warning system would provide real-time information to alert people during storms of the possibility of imminent debris flows. Similar systems have been operated in the San Francisco Bay region and provided real time warnings of debris flows (Keefer and others, 1987). If such a system were implemented, the exceedence of rainfall thresholds calibrated for Madison County could initiate a series of warnings (possibly over NWS broadcasts) that would provide adequate time for evacuation or emergency response. A series of continuously reading rain gages capable of transmitting information during real time to NWS offices would also serve to calibrate radar imagery which measures the amount of moisture available in the clouds and not necessarily the amount that has fallen.
The procedures used to prepare the hazard map of the Madison County area (Plate 2) can be applied toward consideration of potential hazards in other parts of the Blue Ridge and, more generally, along the eastern Appalachian Mountain front from Pennsylvania to Alabama. Recurrence for a debris-flow event in a small area may be one event in three or four thousand years as suggested by Kochel (1987) for the Nelson County, Virginia area. The recurrence interval for debris-flow events will decrease when considering much larger areas. The Virginia State government and its Office of Emergency Services has a responsibility for an area that may have a recurrence interval for debris- flow events of about one event in every ten to twenty years; the Federal Emergency Management Agency has a still larger area of concern, an area that may have a recurrence interval for debris-flow events of about one event in every three to five years in the central and southern Appalachian Mountains based on data from Clark (1987). Over such a broad area encompassing some 160,000 square miles several general principals should remain applicable in considering the potential for the occurrence of debris flows.
Debris flows are triggered by rainstorms with a high intensity lasting for at least several hours. In this area, such storms are most likely to be generated in the Atlantic or Gulf of Mexico where they obtain the prerequisite moisture and move northwestward or westward toward the mountain front. The Appalachians act as an orographic barrier to the weather system forcing the storm to concentrate its energy and lose its moist air close to the land's surface. The storm must sweep over areas with steep slopes. In the Madison area, slopes that failed averaged 30 degrees with a standard deviation of 3.5 degrees. These observations may apply to a wider area, but examination of many historic and prehistoric debris flows in the central and southern Appalachians should be completed to confirm this.
Debris flows may be triggered in many different geologic and topographic settings. Once moving as a fluid slurry, the flows will rapidly move into and down preexisting drainages. Depositional fans with evidence of previous debris flow history can often be identified by reconnaissance methods and provide important indications of areas where debris-flow hazards are likely.
The authors are indebted to the many investigators working in the Madison area who contributed to this report: to Scott Eaton, University of Virginia, and John McGeehin, U.S. Geological Survey for information on Carbon 14 dates of older debris-flow events; to Scott Eaton for collection of information on rainfall at specific sites in the Madison area; to C.S. Southworth, R.H. Orndorff, W.C. Burton, all of the U.S. Geological Survey and to Giuseppe Mandrone, Politecnico di Torino, Italy, for collection of data on debris-flow sources, channels, and fans; to James A. Smith, Princeton University for data on the path of the June, 1997 storm through the Madison area; to Rex L. Baum, U.S. Geological Survey for supervising grain-size determinations; to Kevin Lamb for the use of photographs on Plate 1; and to Peter Chirico, U.S. Geological Survey, for assistance with compter programs to develop Plates 1 and 2.
figure 1 Location map of Madison, Virginia area and regional intensity of rainfall, shown by isohyets, and rain gage stations (149K size)
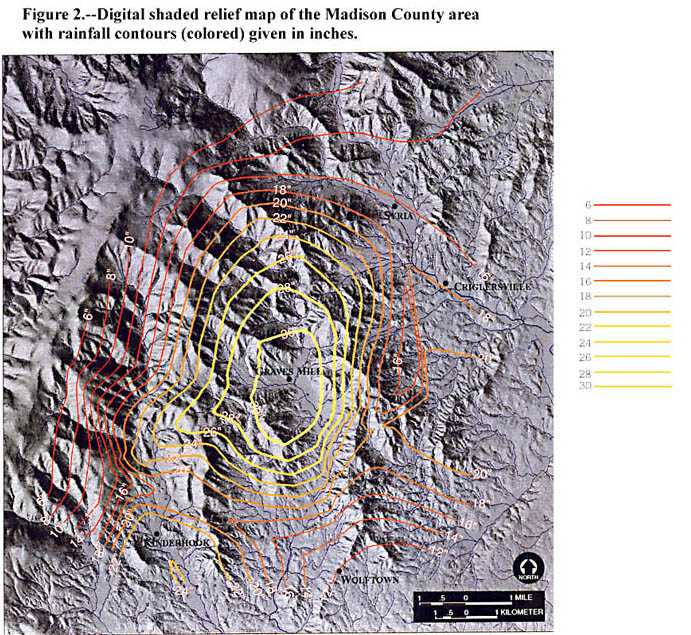
figure 2 Digital shaded relief map of the Madison County area with rainfall contours (red) given in inches (189K size)
figure 3A Grain size distribution of ten samples of matrix from depositional fans

figure 3B Grain size distribution of eighteen samples of matrix from source areas
Plate 1 Isohyetal and Topographic Map with Debris Flow and Flood Effects of the June 27, 1995, Storm in Madison County, Virginia
Plate 2 Debris Flow/Flood Hazard Map of the Area Affected by the June 27, 1995, Storm in Madison County, Virginia
table 1a Data set for debris-flow sources, channels and fans
table 1b Data set for debris-flow sources, channels and fans
table 1c Data set for debris-flow sources, channels and fans
table 2 Rainfall data - Madison County area and other adjacent areas
| AccessibilityFOIAPrivacyPolicies and Notices | |
| |
|