National Assessment of Coastal Vulnerability to Sea-Level Rise:
Preliminary Results for the U.S. Atlantic Coast
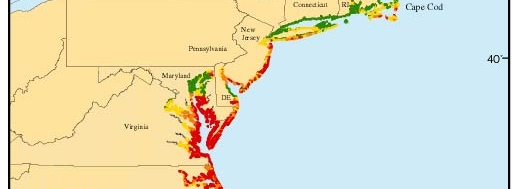
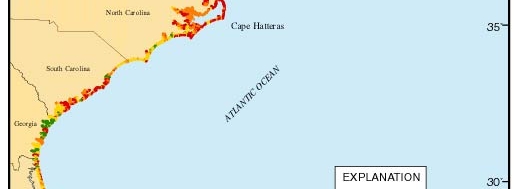
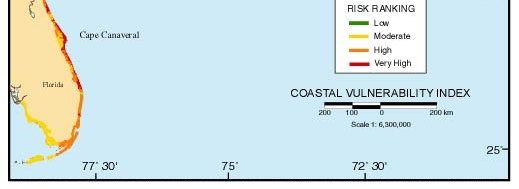
Figure 1. Map of the Coastal Vulnerability Index (CVI) for the U.S. Atlantic Coast. The CVI shows the relative vulnerability of the coast to changes due to future rise in sea-level. Areas along the coast are assigned a ranking from low to high risk, based on the analysis of physical variables that contribute to coastal change.
 |
 |
 |
 |
| Contents | Back to Top | Title Page |
| Introduction | Risk Variables |
Data Ranking |
CVI | Results | Discussion | Summary | References |
|
Web Page by
Donna Newman [an error occurred while processing this directive] |