National Assessment of Coastal Vulnerability to Sea-Level Rise: Preliminary Results for the U.S. Atlantic Coast:
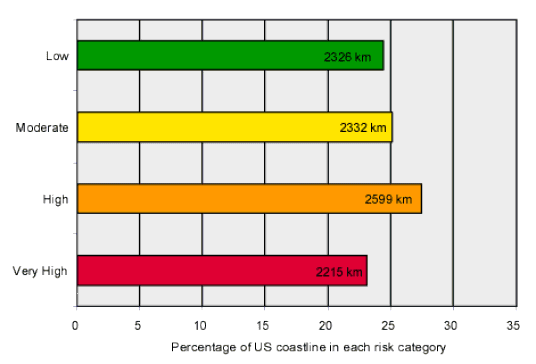
Figure 3. Bar graph showing the percentage of shoreline along the U.S. Atlantic coastal in each risk category. The graph also shows the total length of shoreline (in kilometers) in each risk category. The total length of mapped shoreline in this study is 9,472 km.
 |
| Contents | Back to Top | Title Page |
| Introduction | Risk Variables |
Data Ranking |
CVI | Results | Discussion | Summary | References |
|
Web Page by
Donna Newman [an error occurred while processing this directive] |