National Assessment of Coastal Vulnerability to Sea-Level Rise: Preliminary Results for the U.S. Atlantic Coast:
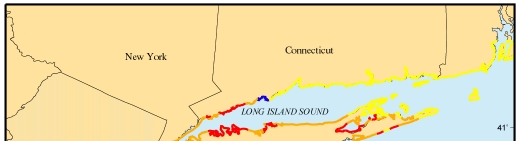
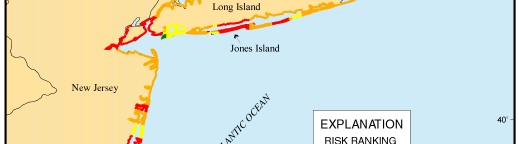
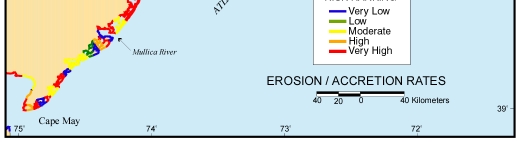
Figure 7. Map of the shoreline erosion/accretion rate variable for the New York to New Jersey region. The smaller-scale variations in the coastal vulnerability indix (CVI) values (see Figure 4) are influenced primarily by changes in the shoreline erosion rate.
 |
 |
 |
| Contents | Back to Top | Title Page |
| Introduction | Risk Variables |
Data Ranking |
CVI | Results | Discussion | Summary | References |
|
Web Page by
Donna Newman [an error occurred while processing this directive] |