|
|
|
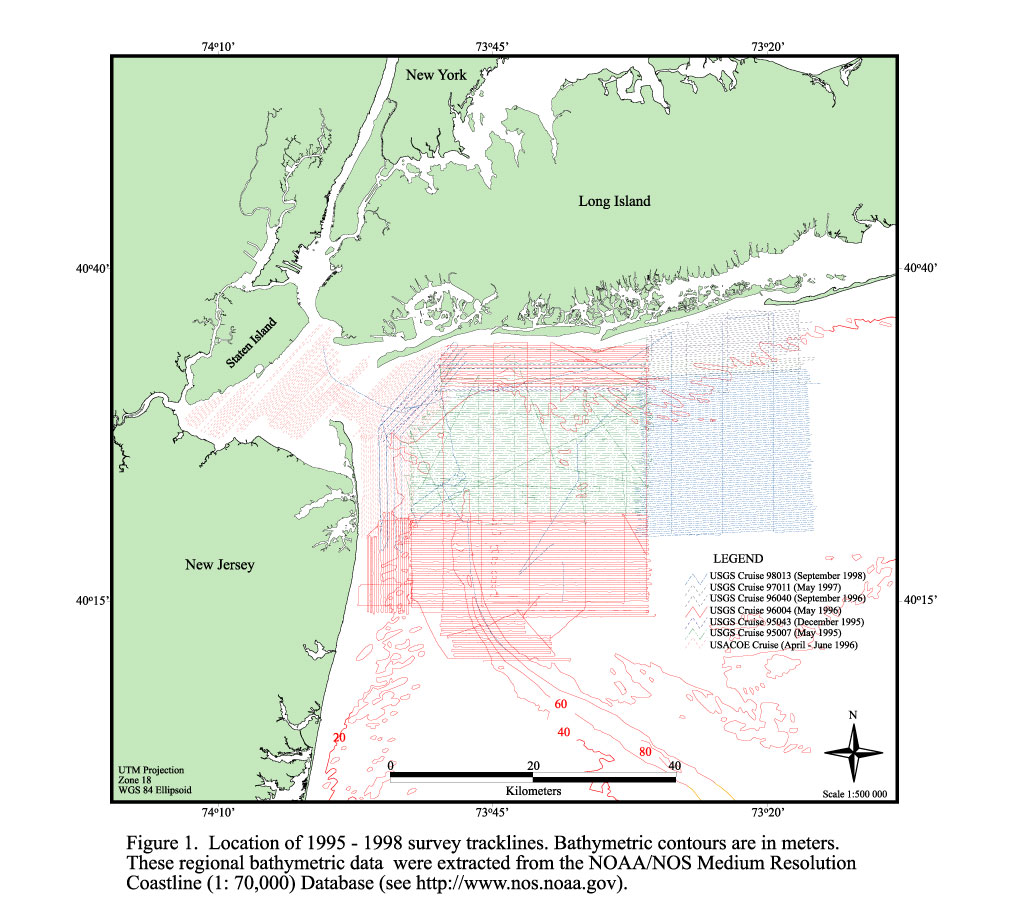
Figure
1. Location of 1995 - 1998 survey tracklines. Bathymetric contours
are in meters. These regional bathymetric data were extracted from
the NOAA/NOS Medium Resolution Coastline (1: 70,000) Database (see
http://www.nos.noaa.gov). |
|
|
|
|
Figure
2. Sidescan-sonar imagery and single beam trackline bathymetry
fathometer) data collected within the New York Bight Apex, 1995
- 1998. See Figure 1 for location of individual cruises. Bathymetry
contours are in meters. High backscatter is represented by light
tones, low backscatter by dark tones. |
|
|
|
|
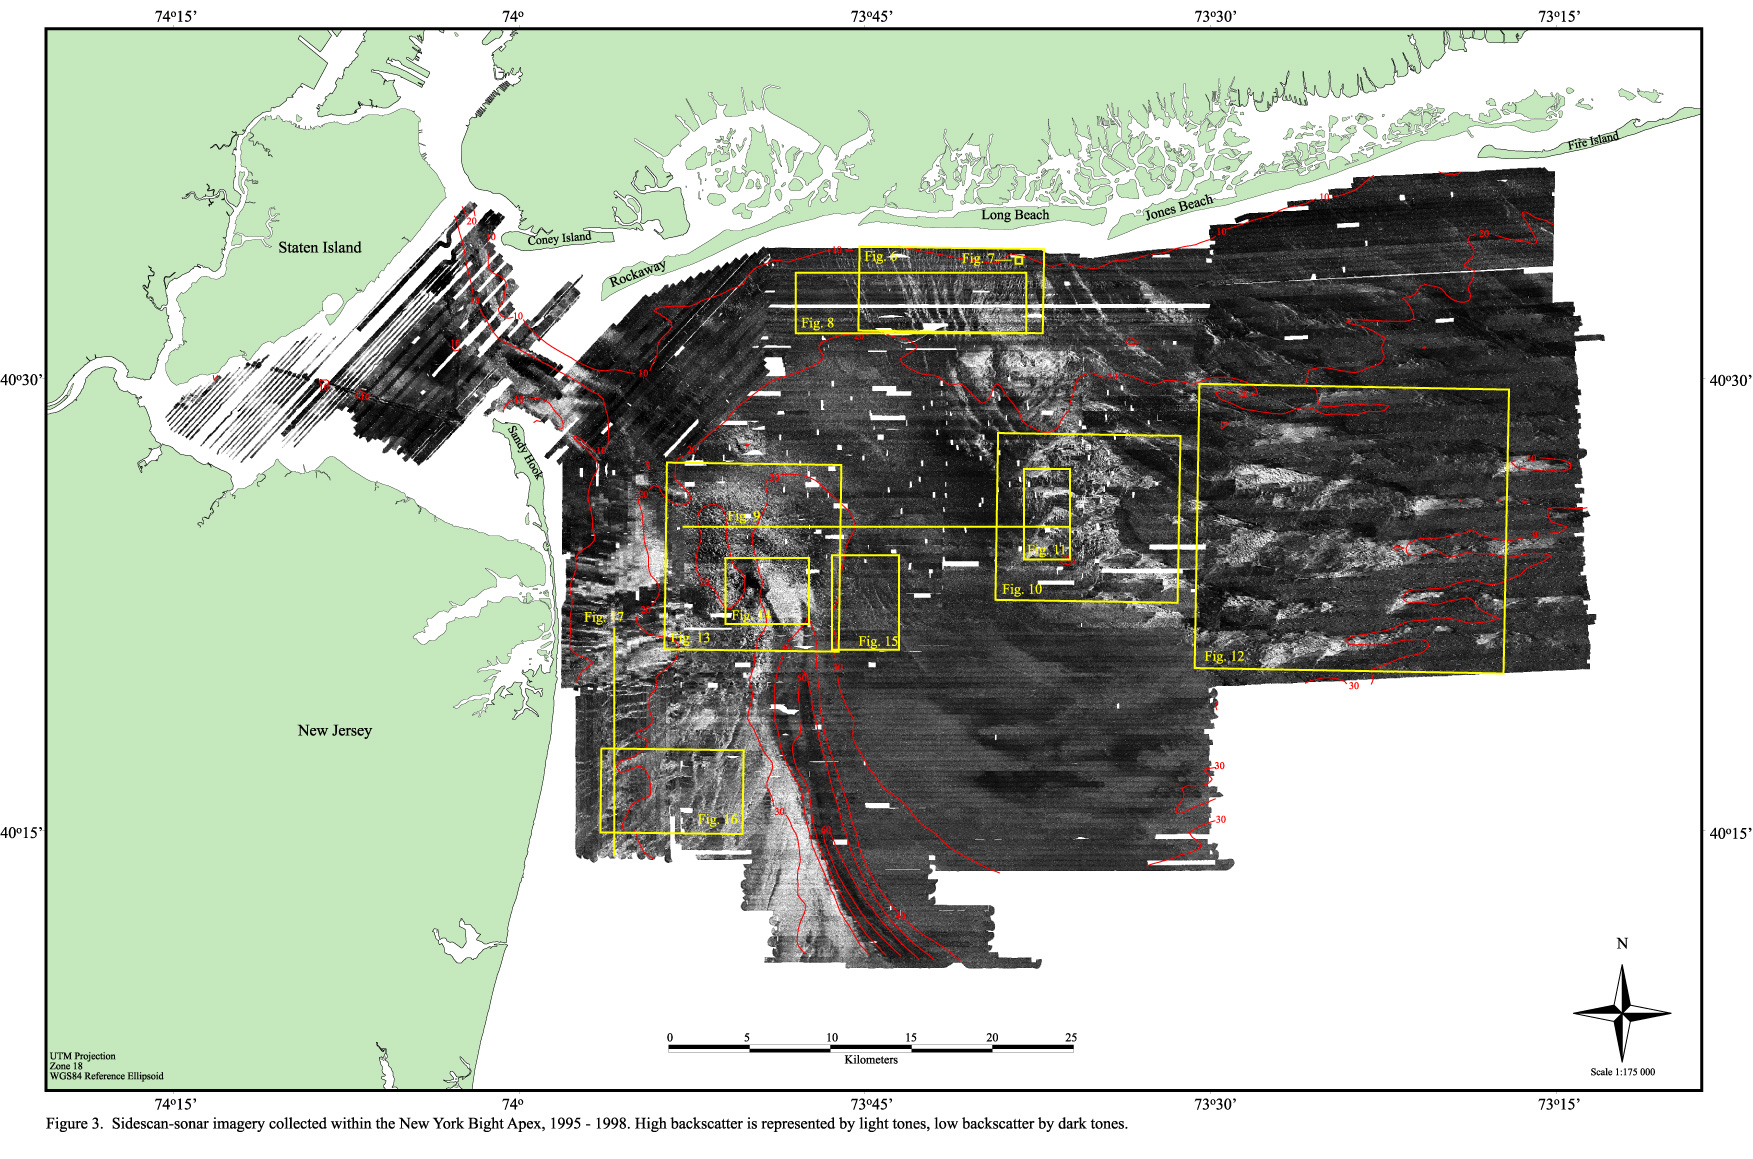
Figure
3. Sidescan-sonar imagery collected within the New York Bight
Apex, 1995 - 1998. High backscatter is represented by light tones,
low backscatter by dark tones. |
|
|
|
|
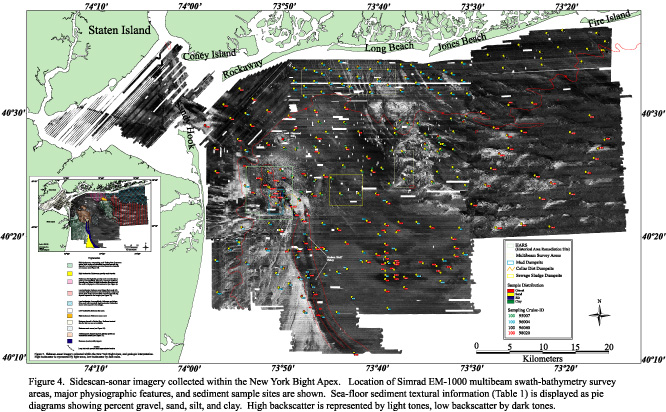
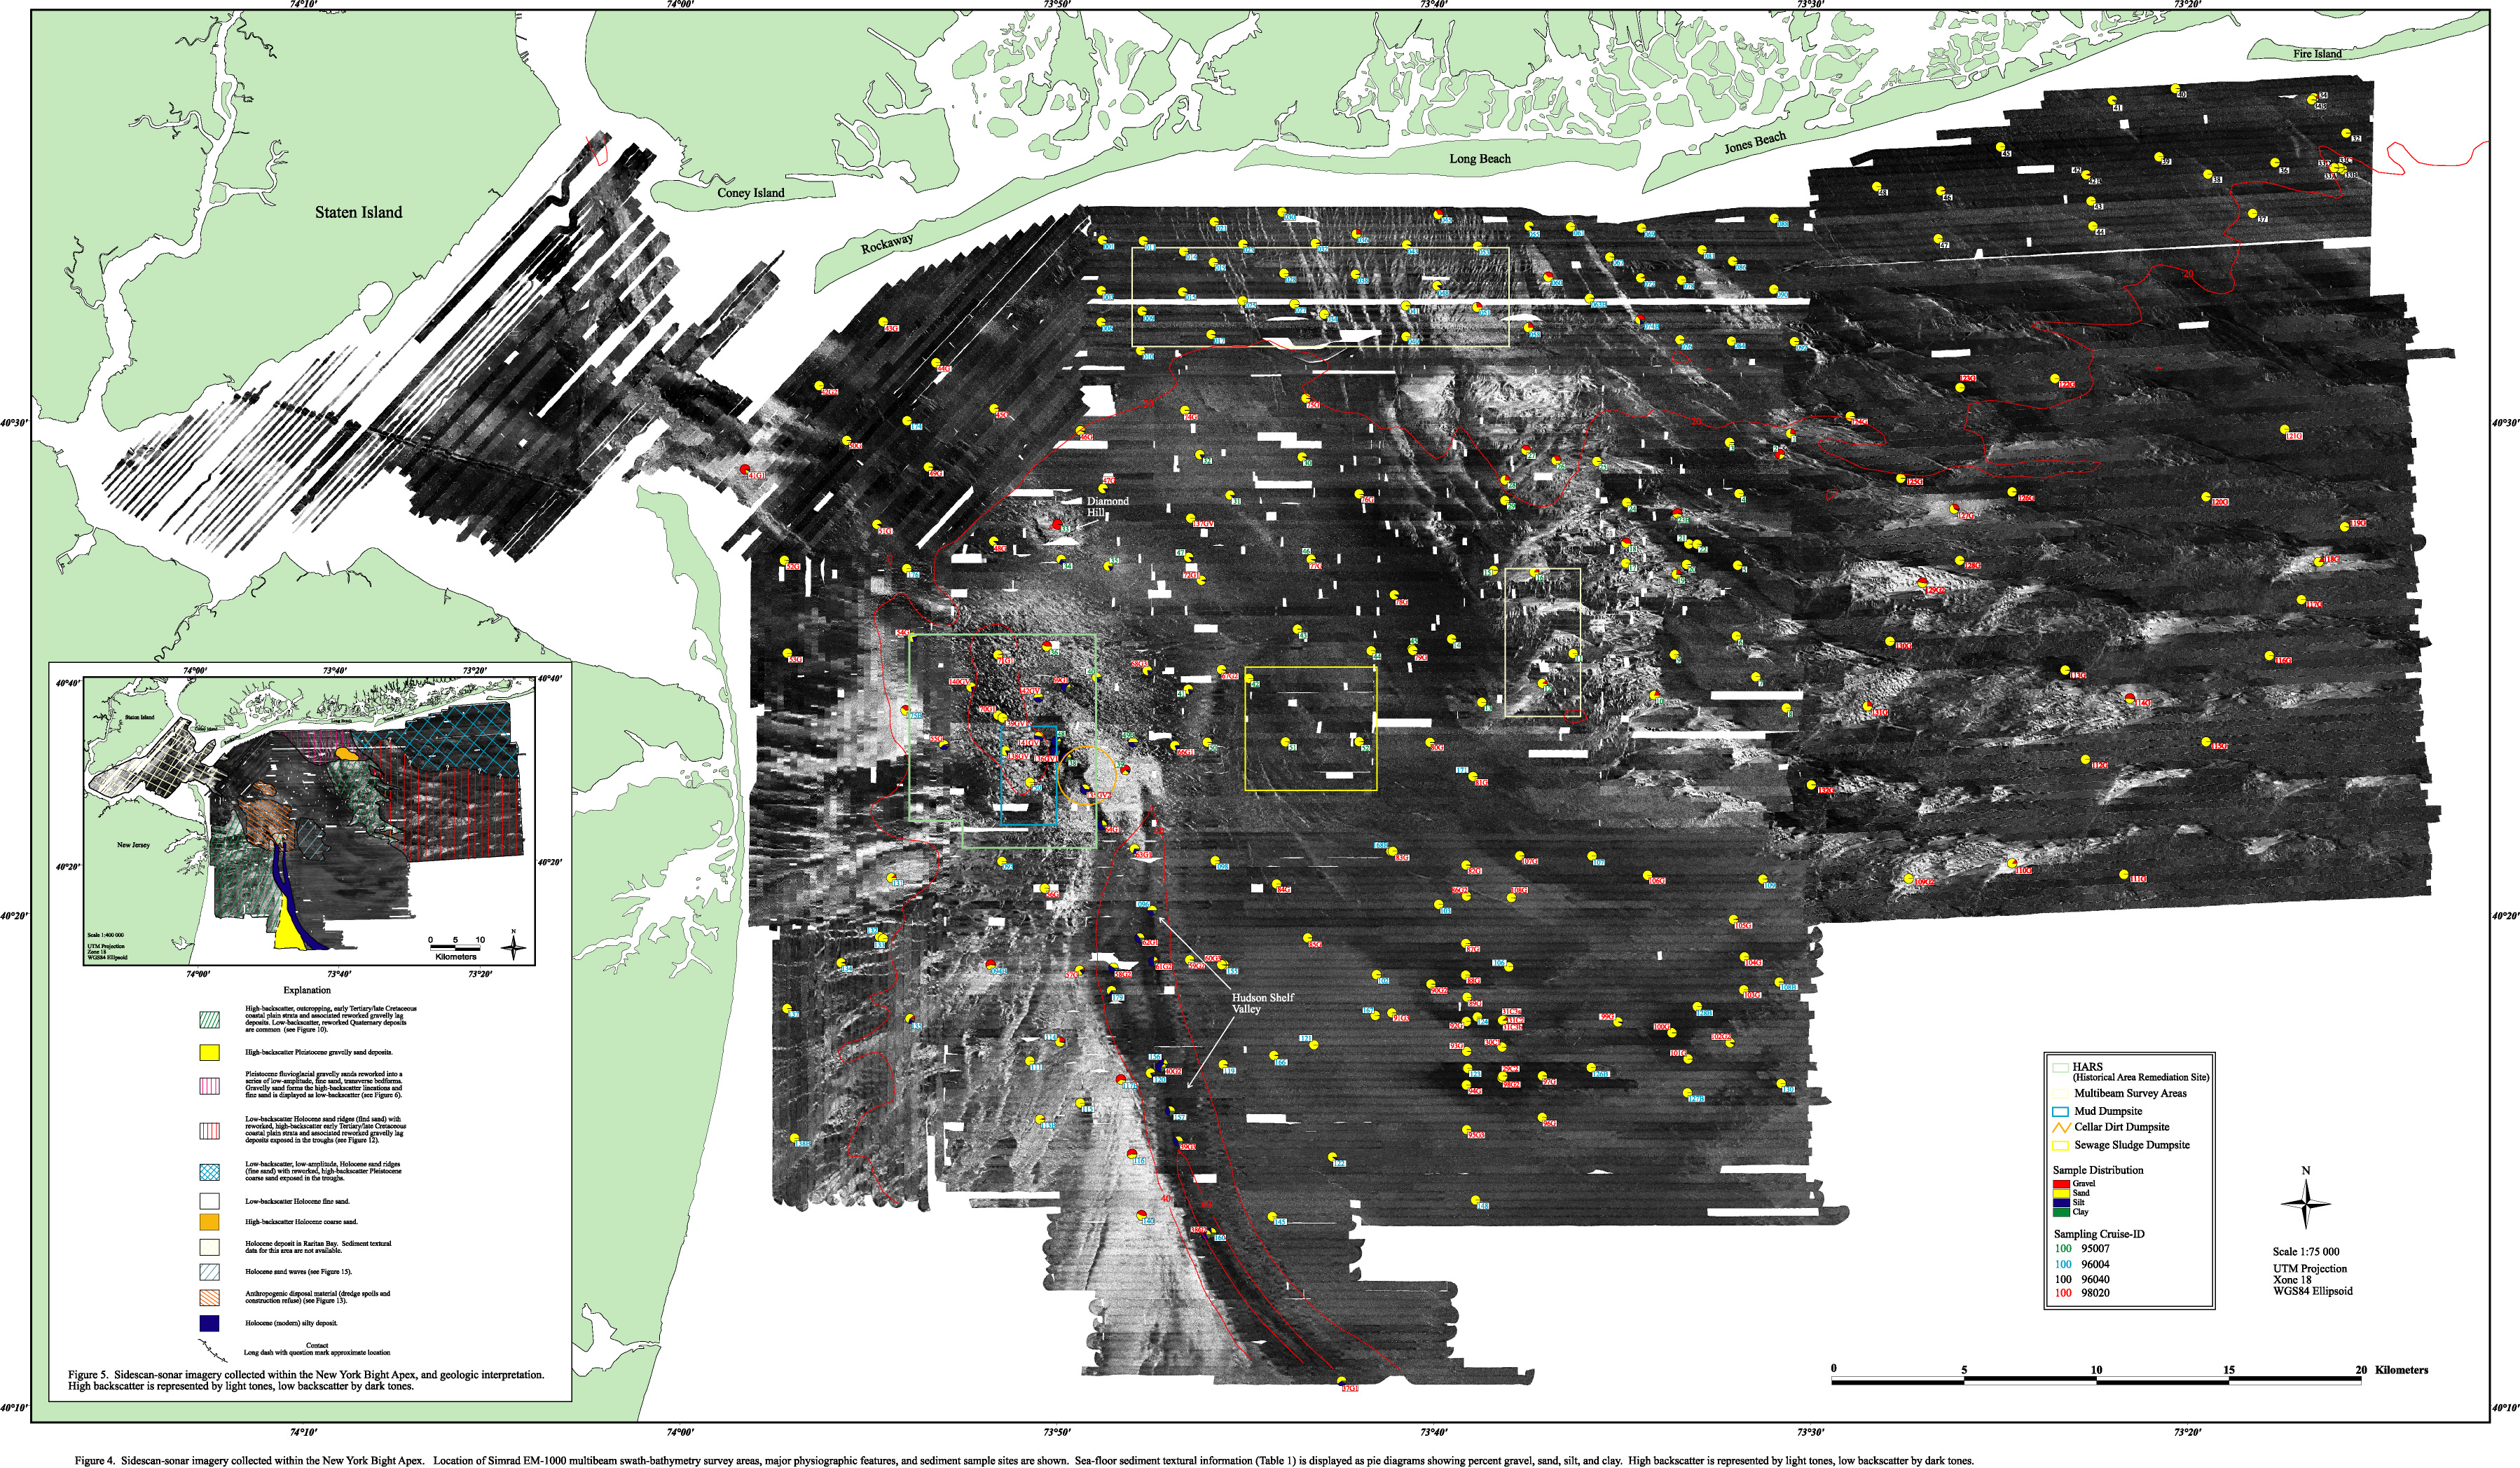
Figure
4. Sidescan-sonar imagery collected within the New York Bight
Apex. Location of Simrad EM-1000 multibeam swath-bathymetry survey
areas, major physiographic features, and sediment sample sites are
shown. Sea-floor sediment textural information (Table 1) is displayed
as pie diagrams showing percent gravel, sand, silt, and clay. High
backscatter is represented by light tones, low backscatter by dark
tones. |
|
|
|
|
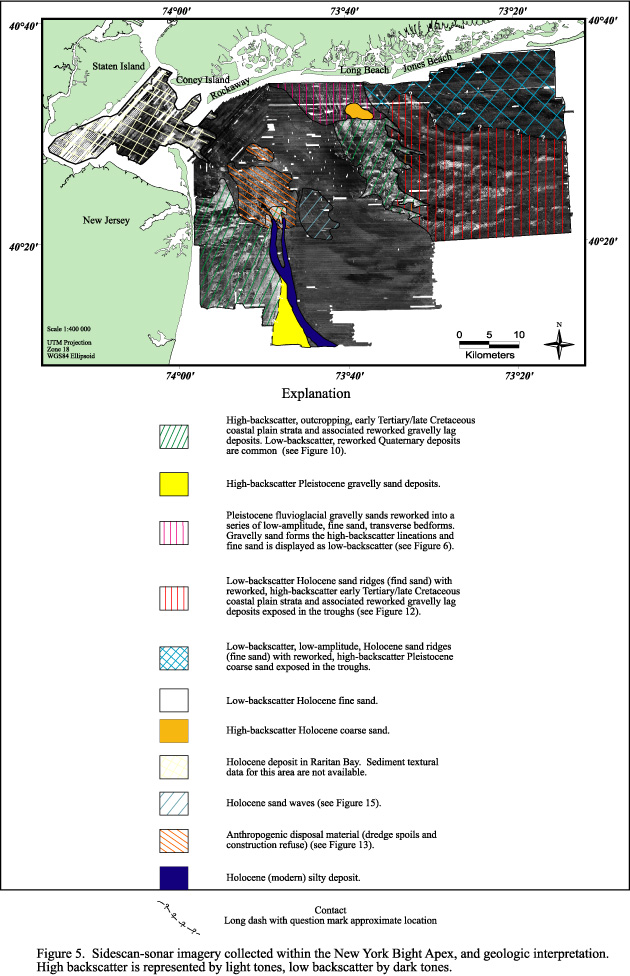
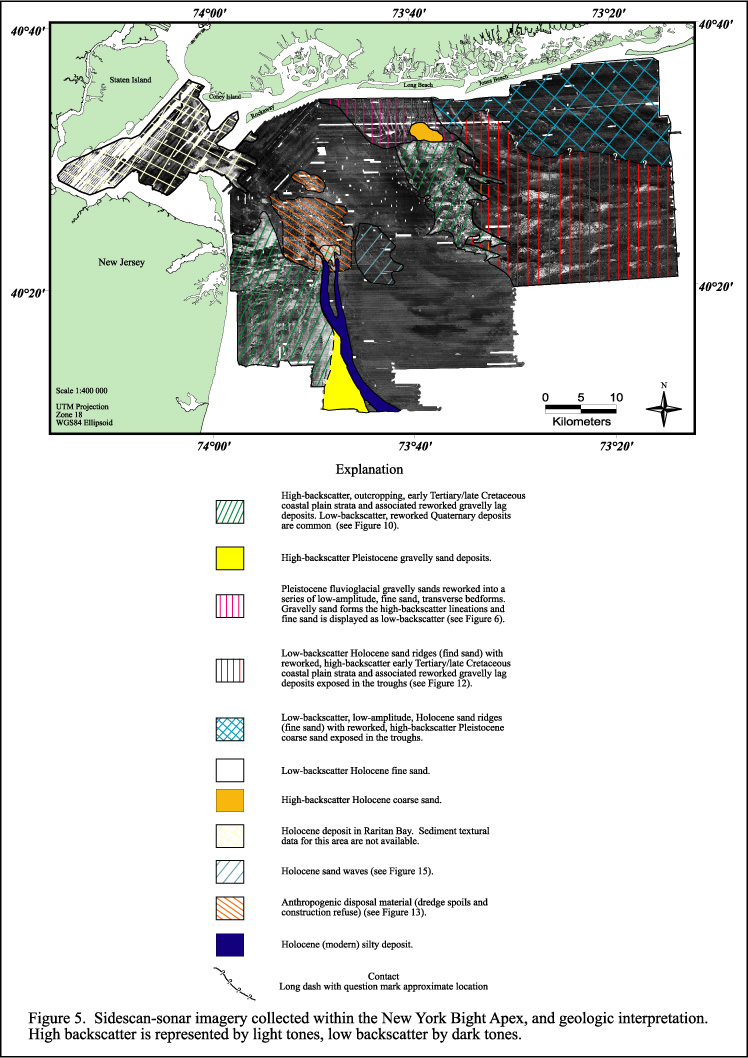
Figure
5. Sidescan-sonar imagery collected within the New York Bight
Apex, and geologic interpretation. High backscatter is represented
by light tones, low backscatter by dark tones. |
|
|
|
|
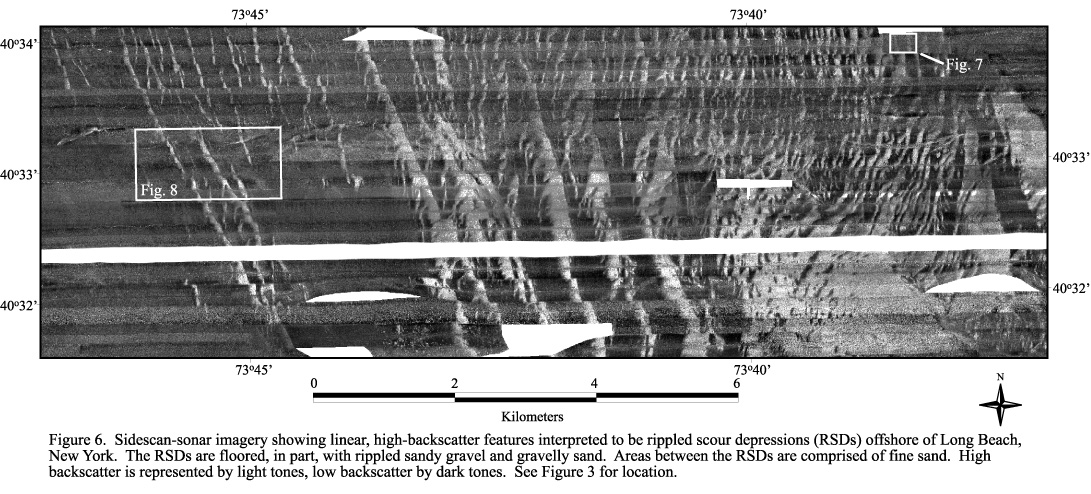
Figure
6. Sidescan-sonar imagery showing linear, high-backscatter features
interpreted to be rippled scour depressions (RSDs) offshore of Long
Beach, New York. The RSDs are floored, in part, with rippled sandy
gravel and gravelly sand. Areas between the RSDs are comprised of
fine sand. High backscatter is represented by light tones, low backscatter
by dark tones. See Figure 3 for location. |
|
|
|
|
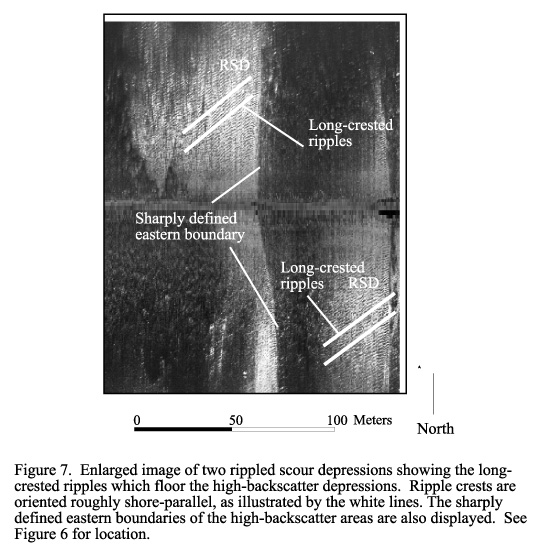
Figure
7. Enlarged image of two rippled scour depressions showing the
long-crested ripples which floor the high-backscatter depressions.
Ripple crests are oriented roughly shore-parallel, as illustrated
by the white lines. The sharply defined eastern boundaries of the
high-backscatter areas are also displayed. See Figure 6 for location. |
|
|
|
|
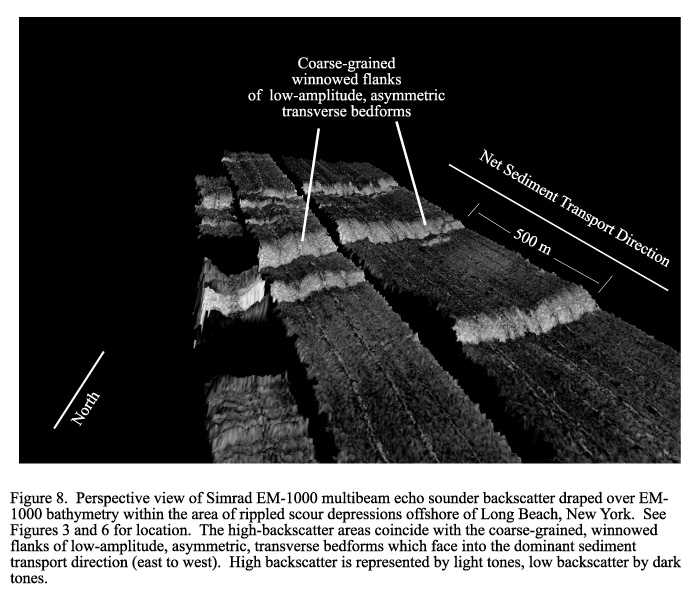
Figure
8. Perspective view of Simrad EM-1000 multibeam echo sounder
backscatter draped over EM-1000 bathymetry within the area of rippled
scour depressions offshore of Long Beach, New York. See Figures
3 and 6 for location. The high-backscatter areas coincide with the
coarse-grained, winnowed flanks of low-amplitude, asymmetric, transverse
bedforms which face into the dominant sediment transport direction
(east to west). High backscatter is represented by light tones,
low backscatter by dark tones. |
|
|
|
|
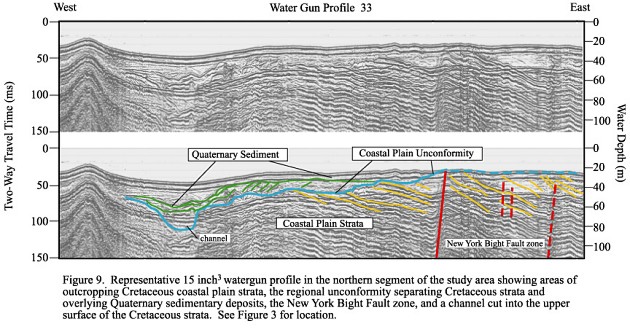
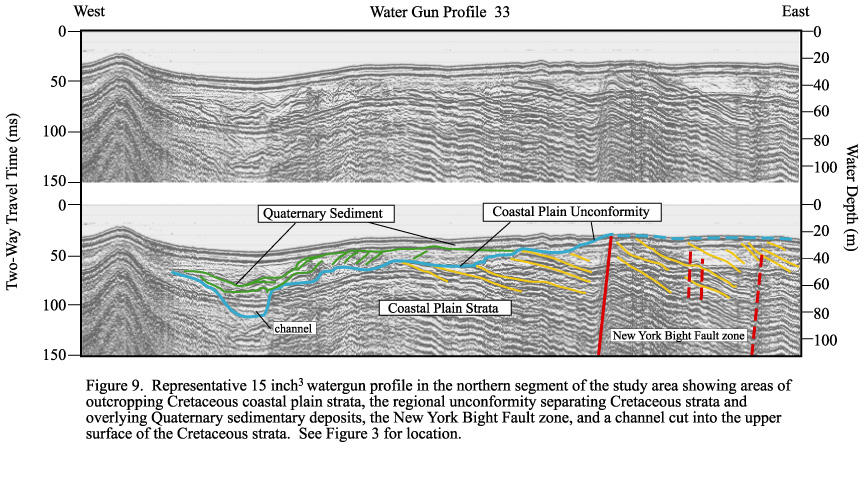
Figure
9. Representative 15 inch3 watergun profile in the northern
segment of the study area showing areas of outcropping Cretaceous
coastal plain strata, the regional unconformity separating Cretaceous
strata and overlying Quaternary sedimentary deposits, the New York
Bight Fault zone, and a channel cut into the upper surface of the
Cretaceous strata. See Figure 3 for location. |
|
|
|
|
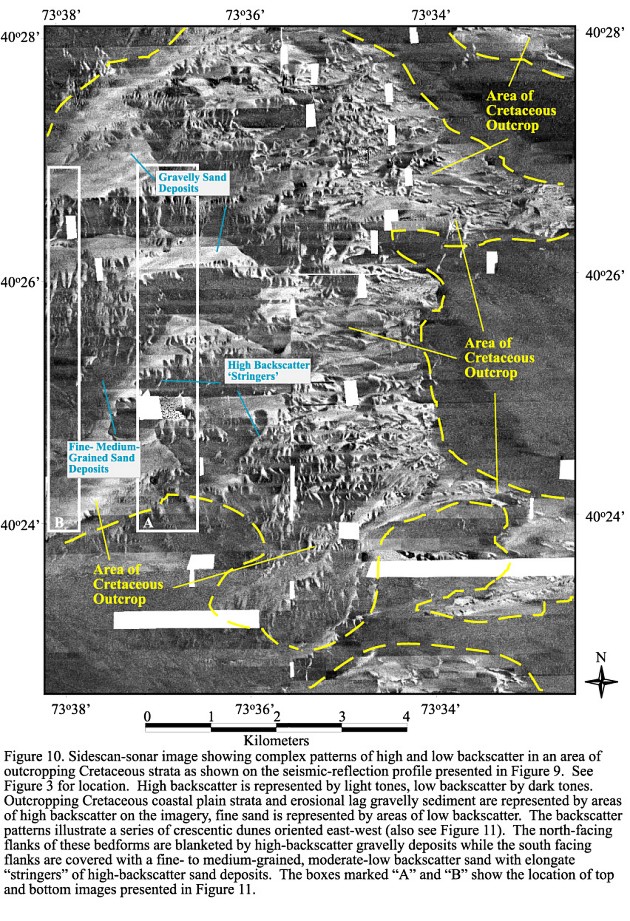
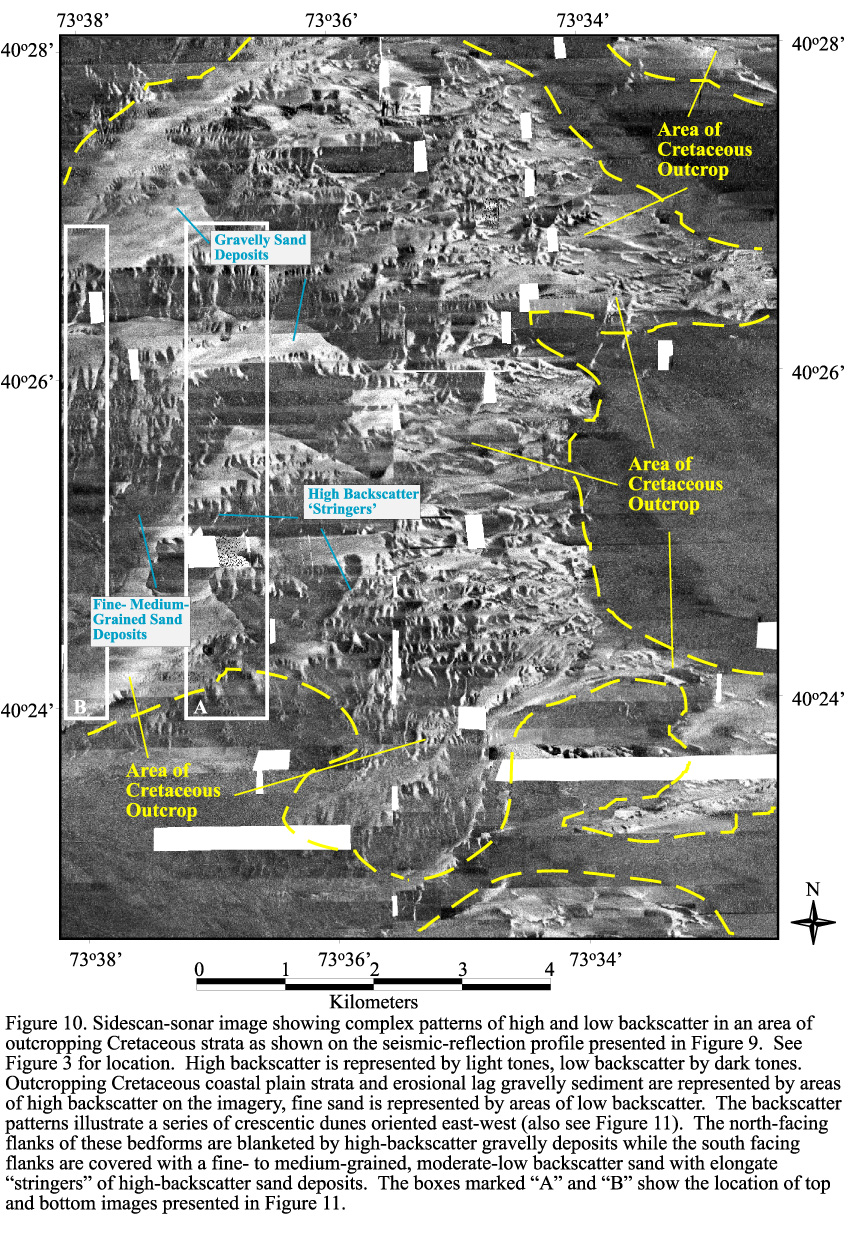
Figure
10. Sidescan-sonar image showing complex patterns of high and
low backscatter in an area of outcropping Cretaceous strata as shown
on the seismic-reflection profile presented in Figure 9. See Figure
3 for location. High backscatter is represented by light tones,
low backscatter by dark tones. Outcropping Cretaceous coastal plain
strata and erosional lag gravelly sediment are represented by areas
of high backscatter on the imagery, fine sand is represented by
areas of low backscatter. The backscatter patterns illustrate a
series of crescentic dunes oriented east-west (also see Figure 11).
The north-facing flanks of these bedforms are blanketed by high-backscatter
gravelly deposits while the south facing flanks are covered with
a fine- to medium-grained, moderate-low backscatter sand with elongate
“stringers” of high-backscatter sand deposits. The boxes marked
“A” and “B” show the location of top and bottom images presented
in Figure 11. |
|
|
|
|
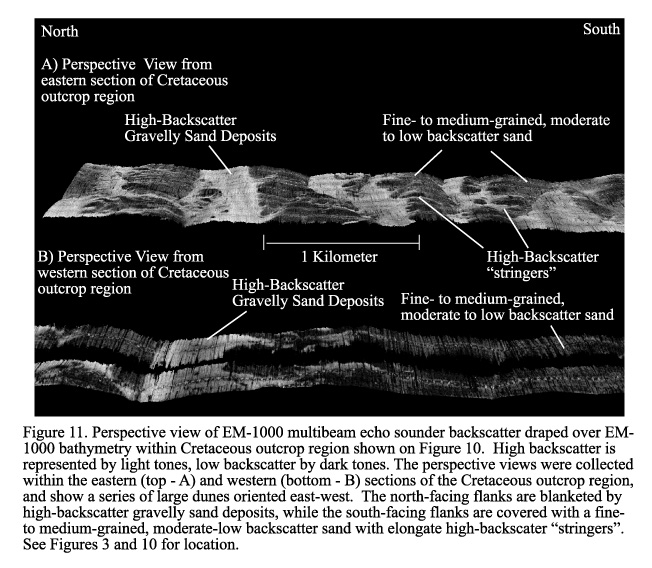
Figure
11. Perspective view of EM-1000 multibeam echo sounder backscatter
draped over EM-1000 bathymetry within Cretaceous outcrop region
shown on Figure 10. High backscatter is represented by light tones,
low backscatter by dark tones. The perspective views were collected
within the eastern (top - A) and western (bottom - B) sections of
the Cretaceous outcrop region, and show a series of large dunes
oriented east-west. The north-facing flanks are blanketed by high-backscatter
gravelly sand deposits, while the south-facing flanks are covered
with a fine- to medium-grained, moderate-low backscatter sand with
elongate high-backscater “stringers”. See Figures 3 and 10 for location. |
|
|
|
|
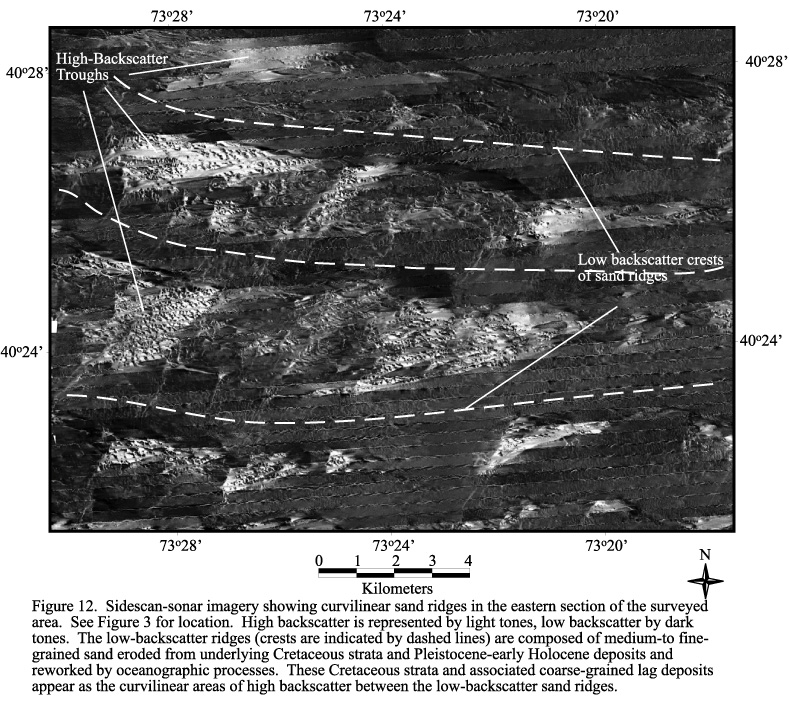
Figure
12. Sidescan-sonar imagery showing curvilinear sand ridges in
the eastern section of the surveyed area. See Figure 3 for location.
High backscatter is represented by light tones, low backscatter
by dark tones. The low-backscatter ridges (crests are indicated
by dashed lines) are composed of medium-to fine-grained sand eroded
from underlying Cretaceous strata and Pleistocene-early Holocene
deposits and reworked by oceanographic processes. These Cretaceous
strata and associated coarse-grained lag deposits appear as the
curvilinear areas of high backscatter between the low-backscatter
sand ridges. |
|
|
|
|
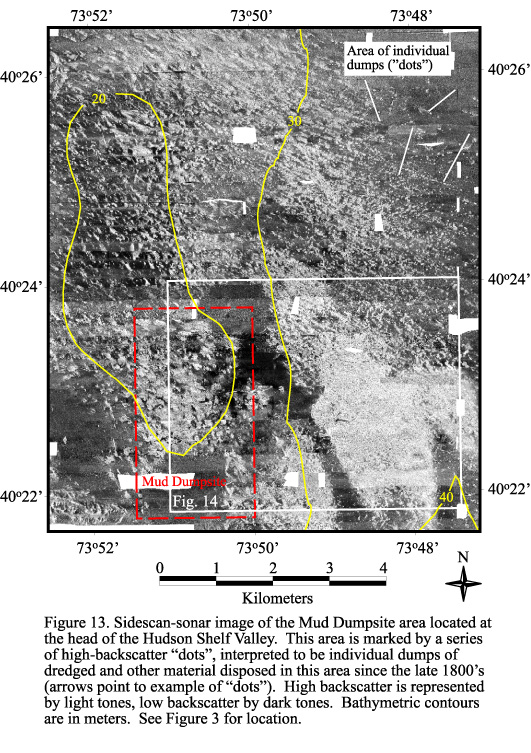
Figure
13. Sidescan-sonar image of the Mud Dumpsite area located at
the head of the Hudson Shelf Valley. This area is marked by a series
of high-backscatter “dots”, interpreted to be individual dumps of
dredged and other material disposed in this area since the late
1800’s (arrows point to example of “dots”). High backscatter is
represented by light tones, low backscatter by dark tones. Bathymetric
contours are in meters. See Figure 3 for location. |
|
|
|
|
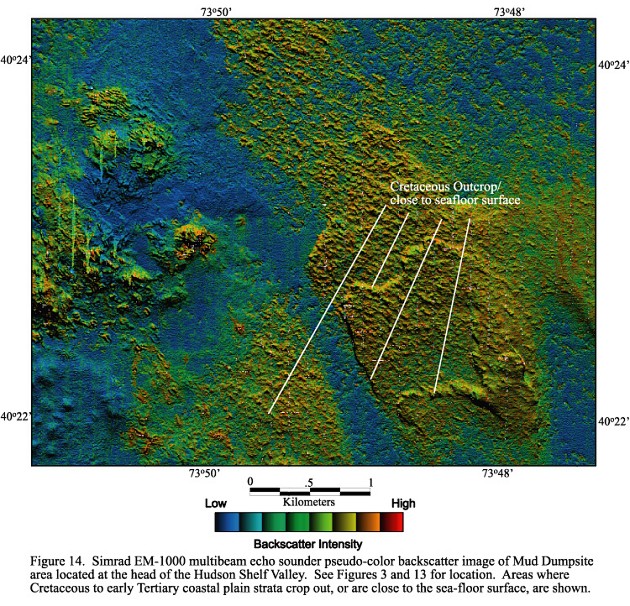
Figure
14. Simrad EM-1000 multibeam echo sounder pseudo-color backscatter
image of Mud Dumpsite area located at the head of the Hudson Shelf
Valley. See Figures 3 and 13 for location. Areas where Cretaceous
to early Tertiary coastal plain strata crop out, or are close to
the sea-floor surface, are shown. |
|
|
|
|
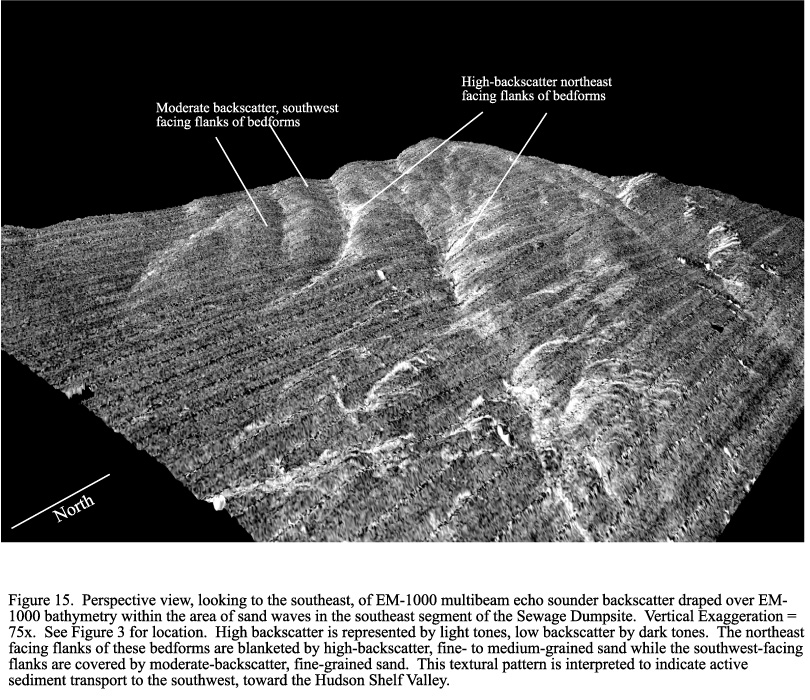
Figure
15. Perspective view, looking to the southeast, of EM-1000 multibeam
echo sounder backscatter draped over EM-1000 bathymetry within the
area of sand waves in the southeast segment of the Sewage Dumpsite.
Vertical Exaggeration = 75x. See Figure 3 for location. High backscatter
is represented by light tones, low backscatter by dark tones. The
northeast facing flanks of these bedforms are blanketed by high-backscatter,
fine- to medium-grained sand while the southwest-facing flanks are
covered by moderate-backscatter, fine-grained sand. This textural
pattern is interpreted to indicate active sediment transport to
the southwest, toward the Hudson Shelf Valley. |
|
|
|
|
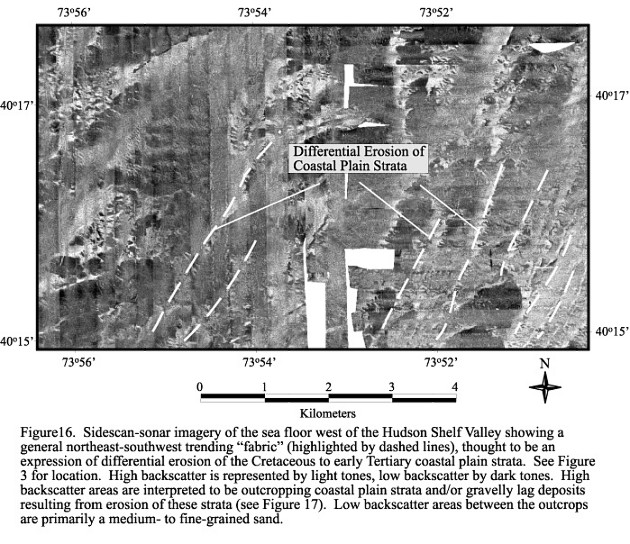
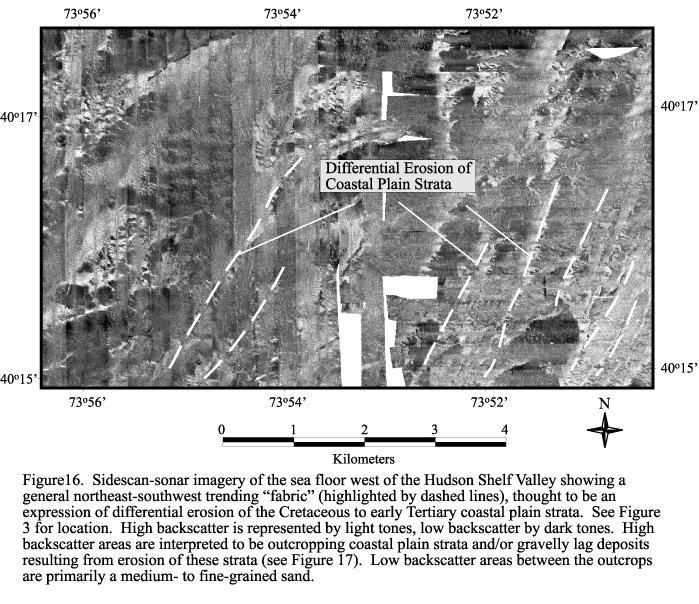
Figure16.
Sidescan-sonar imagery of the sea floor west of the Hudson Shelf
Valley showing a general northeast-southwest trending “fabric” (highlighted
by dashed lines), thought to be an expression of differential erosion
of the Cretaceous to early Tertiary coastal plain strata. See Figure
3 for location. High backscatter is represented by light tones,
low backscatter by dark tones. High backscatter areas are interpreted
to be outcropping coastal plain strata and/or gravelly lag deposits
resulting from erosion of these strata (see Figure 17). Low backscatter
areas between the outcrops are primarily a medium- to fine-grained
sand. |
|
|
|
|
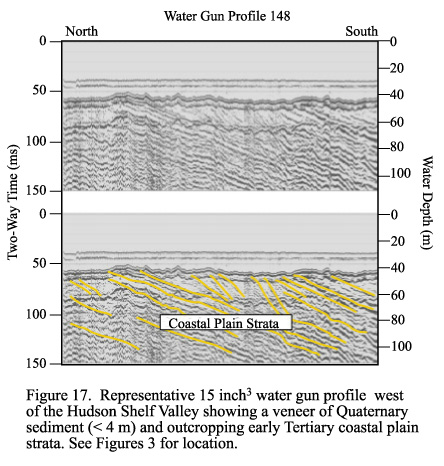
Figure
17. Representative 15 inch3 water gun profile west of the Hudson
Shelf Valley showing a veneer of Quaternary sediment (< 4 m) and
outcropping early Tertiary coastal plain strata. See Figures 3 for
location. |
|
|
|
|
Table
1. New York Apex Sediment Samples |


