 |
|
|
||||
| OFR 01-0429: World Trade Center USGS Imaging Spectroscopy |
| About USGS / Science Topics / Maps, Products & Publications / Education / FAQ |
Contents |
The AVIRIS instrument measures upwelling spectral radiance in the visible through short-wavelength infrared. The instrument has 224 spectral channels (bands) with wavelengths from 0.37 to 2.5 microns (micrometers) with sufficient spectral resolution to characterize diagnostic spectral features in materials. AVIRIS was flown at 2 altitudes in the WTC area for this study to give pixel sizes of approximately 2 and 4 meters.
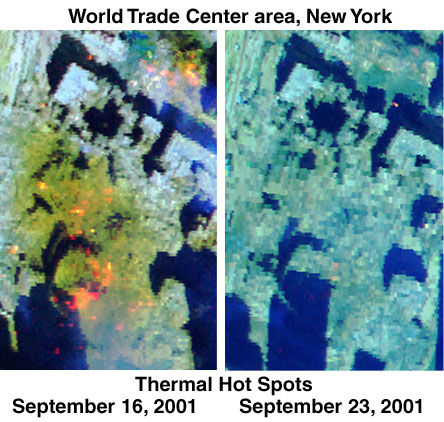
The AVIRIS instrument was flown by NASA/JPL over the World Trade Center (WTC) area on Sept 16, 18, 22, and 23, 2001, after the attack on the WTC. This page shows results of analysis of the Sept 16 data. Collection of data on Sept 18 and 22 was hampered by clouds. Analysis of the Sept. 23 data includes an assessment of the change in thermal hot spots.
The 13 Gigabytes of September 16th data were sent to the USGS in Denver on September 17-18th. Atmospheric absorptions, instrument response and the solar spectrum were removed using ground calibration that employs spectra of large, uniform areas in new Jersey outside the WTC debris zone. The areas were spectrally calibrated with real-time feedback from a field crew (Gregg Swayze and Todd Hoefen) on site with portable field spectrometers (Sept. 17-19).
The calibration measurements, field site, and AVIRIS coverage of the New York area are detailed within the next link. This is a data page and includes registered images with map coordinates for context. This page does not need to be read to follow the analysis and conclusions of this report, but is included for others trying to work with the AVIRIS data. Click here for the field spectral measurements, registered images, and calibration site information.
Once calibrated, the data were analyzed for the presence of specific spectral features to identify materials expressed in the spectrum at each pixel in the image. The methods employed, from calibration, to imaging spectroscopy analysis (the Tetracorder analysis system), to verification of results follows the procedures and methods established in Clark and Roush (1984), Clark et al., (1990b, 1991, 1995, 2001), Clark 1999, King et al., (2000), and Swayze et al., (2000). Reference spectra for the mapping are from Clark et al., (1993), Clark (1999), measurements made for the above studies, and this study.
Because AVIRIS measures reflected sunlight it cannot detect materials deeper than can be seen with the human eye. For most solid materials this optical penetration is measured in millimeters.
The materials maps below from AVIRIS and the USGS Tetracorder analysis (Clark et al., 2001) describe results from the imaging spectroscopy analysis. Click on the thumbnails or text below for full resolution image maps and explanatory text.
Thermal hot-spot maps. Images of the World Trade Center site show significant thermal hot spots on Sept. 16, 2001. By Sept. 23, 2001, most of the hot spots had cooled or the fires had been put out. The thermal images show the relative ground temperature at the World Trade Center for Sunday Sept 16, 2001 using infrared wavelengths sensitive to high temperatures. Red, orange, and yellow spots are regions of high thermal emission (high temperatures) with the yellow areas being the hottest and red the coolest.
| Serpentine and Amphibole minerals map. |
Serpentine and Amphibole minerals map, same as at right, but zoomed in to lower Manhattan. |
| Dust/Debris plume map. |
Dust/Debris plume map, same as at right, but zoomed in to lower Manhattan. |
| Ferrous, ferric iron absorption features map. |
Ferrous, ferric iron absorption features map, same as at right, but zoomed in to lower Manhattan. |
| Vibrational absorption features map. |
Vibrational absorption absorption features map, same as at right, but zoomed in to lower Manhattan. |
| Organic materials absorption map. |
Organic materials absorption map, same as at right, but zoomed in to lower Manhattan. |
Back to document Table of Contents
For further information, contact:
Dr. Roger N. Clark
rclark@usgs.gov
Link to the AVIRIS JPL data facility)
For information about AVIRIS, contact:
Robert O. Green
AVIRIS Experiment Scientist
rog@spectra.jpl.nasa.gov
| AccessibilityFOIAPrivacyPolicies and Notices | |
| |
|