Ground-Water Flow System and Water Levels in the Floridan Aquifer System
The principal recharge area of the Upper Floridan aquifer in northeastern Florida is southwest of Duval County
. Within this recharge area, water enters the Upper Floridan by downward leakage from the surficial aquifer system through breaches in the intermediate confining unit caused by sinkholes or where the confining unit is thin or missing, and by lateral inflow. Water is discharged from the Upper Floridan aquifer by pumpage, by diffuse upward leakage of water to the surficial aquifer system where the potentiometric surface of the Upper Floridan aquifer is above the water table, by lateral outflow, and by free-flowing wells.
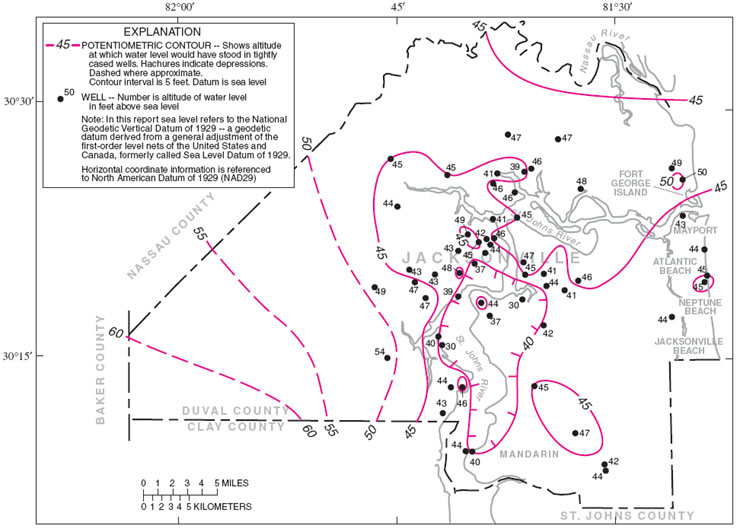
General areas of recharge and discharge and the direction of ground-water movement can be determined from potentiometric surface maps. The potentiometric surface is an imaginary surface to which water from an artesian aquifer will rise in tightly cased wells that penetrate the aquifer. Ground water in the Floridan aquifer system moves from areas of high potential head to areas of low potential head, generally along flow lines perpendicular to the lines of equal head. The generalized configuration of the potentiometric surface of the Upper Floridan aquifer in Duval County for January-February 1960 (Leve, 1961) is shown in
. The January-February 1960 potentiometric surface map was one of the first such maps constructed for Duval County. It represents conditions somewhere between the seasonal high and seasonal low water levels. The potentiometric surface ranged from more than 60 ft above sea level in extreme southwestern Duval County to about 30 ft above sea level in the depression in the south-central part of the county. The depression in the potentiometric surface is believed to be caused primarily by withdrawals from public-supply and industrial wells, and possibly by the natural discharge of water from the Upper Floridan aquifer into the St. Johns River combined with aquifer transmissivity variations (Phelps, 1994).
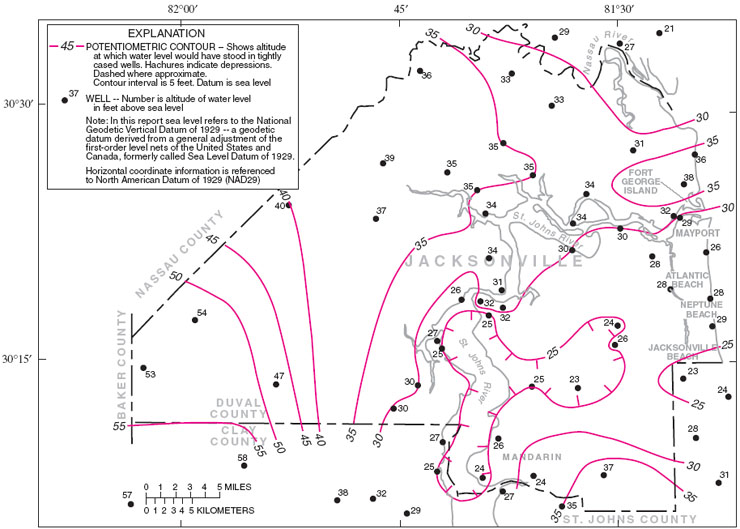
Potentiometric surface maps of the Upper Floridan aquifer for September 1998 and May 1999 for Duval County are shown in
and
, respectively. Potentiometric surface maps for 2000 or 2001 were not included in this report, because water levels for those years were at or near record lows due to drought conditions, which were affecting much of the State, and, therefore, would not be representative of normal May and September water levels. The September 1998 potentiometric surface
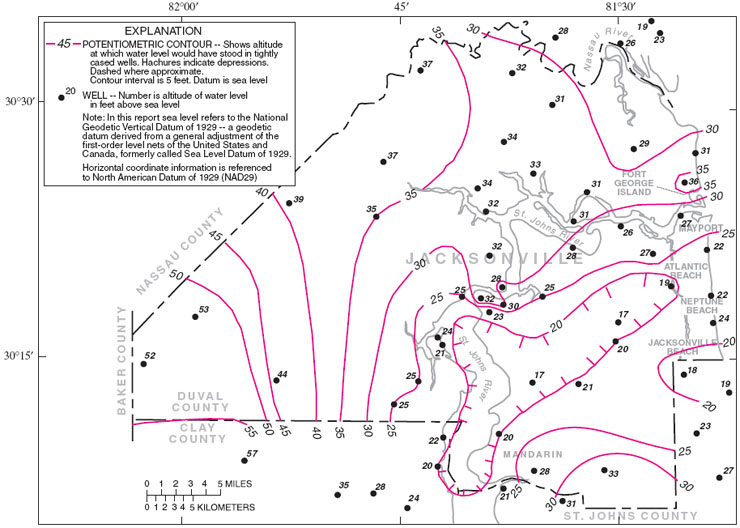
represents conditions near the end of the wet season, when withdrawals from the aquifer are near minimum and water levels generally are near their highest. The potentiometric surface ranges from about 54 ft above sea level in the extreme southwestern part of the county to 23 ft above sea level within the depression in the south-central part of the county (Bradner, 1999). The May 1999 potentiometric surface represents conditions near the end of the dry season
, when withdrawals from the aquifer are near maximum and water levels generally are near their annual low. The potentiometric surface ranged from about 53 ft to about 17 ft above sea level (Bradner and Knowles, 1999). Water levels in May 1999 averaged about 1 to 7 ft lower than in September 1998.
Figure 4. Potentiometric surface of the Upper Floridan aquifer, January-February 1960 (modified from Leve, 1961). [
]
Figure 5. Potentiometric surface of the Upper Floridan aquifer, September 1998 (from Bradner, 1999). [
]
Figure 6. Potentiometric surface of the Upper Floridan aquifer, May 1999 (modified from Bradner and Knowles, 1999). [
]
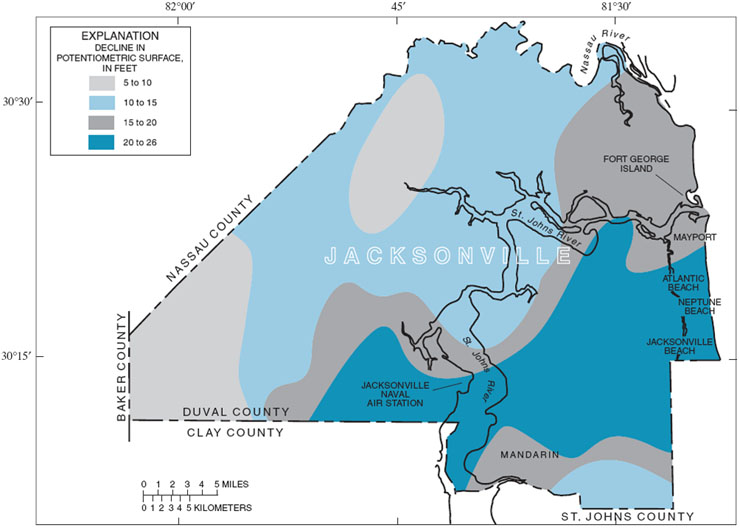
A comparison of the January-February 1960 potentiometric surface (Leve, 1961) with that of May 1999 (Bradner, 1999) shows that heads in most of the county have declined from 5 to 26 ft since 1960
. The degree of decline in the potentiometric surface varies depending on the location within Duval County. The smallest declines (less than 10 ft) were in the northwestern and extreme western part of the county, away from areas of large ground-water withdrawals. Declines ranging from 10 to 20 ft occured primarily in the northern half of Duval County. The greatest decline (greater than 20 ft) occurred mostly in southeastern and south-central Duval County, and is due primarily to increased withdrawals of water for public supply.
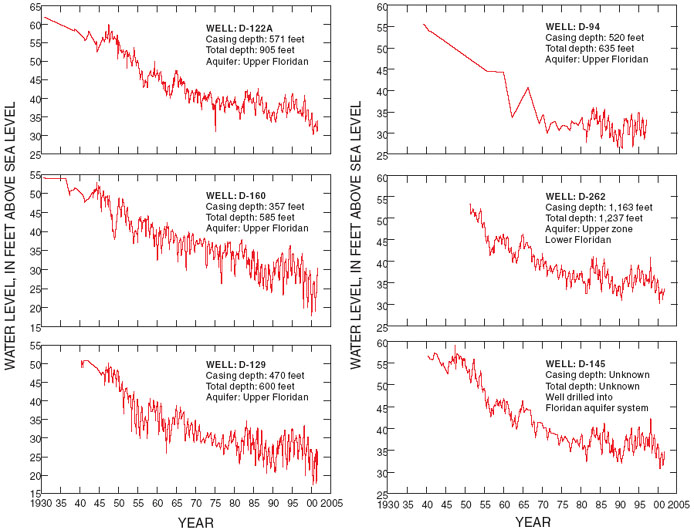
The potentiometric surface of the Upper Floridan aquifer is constantly fluctuating, mainly in response to ground-water withdrawals and seasonal variations in rainfall. This can be illustrated by long-term seasonal and year-to-year fluctuations of water levels measured in six wells
open to the Floridan aquifer system in Duval County
. A comparison of hydrographs and analysis of water-level data collected for the biannual potentiometric surface maps shows that the September water levels generally range from 2 to 5 ft higher than May water levels. During periods of deficient rainfall, however, declines between September and May locally can be greater in heavily pumped areas.
Figure 7. Approximate decline in potentiometric surface of the Upper Floridan aquifer from January-February 1960 to May 1999. [
]
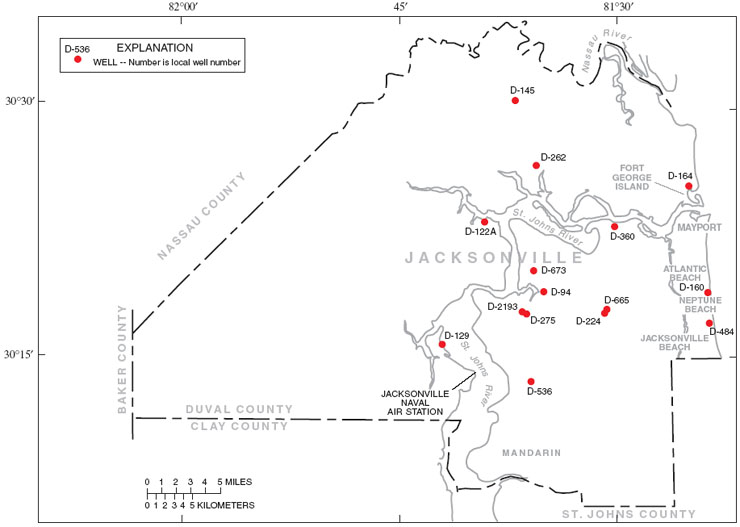
Figure 8. Selected wells with long-term water-level or chloride concentration data. [
]
Figure 9. Water levels in selected wells tapping the Floridan aquifer system (well location shown in figure 8). [
]
Long-term hydrographs of Floridan aquifer system monitoring wells indicate a downward trend of water levels in many wells in Duval County. Water levels measured in six monitoring wells
show declines of about 25-30 ft from the 1940s to 2001. Although some of the water-level declines may be a result of long-term below-average rainfall, much of the declines can be attributed to increased pumpage. The hydrographs show that for much of the record, declines were observed whether there was a surplus or deficiency in rainfall
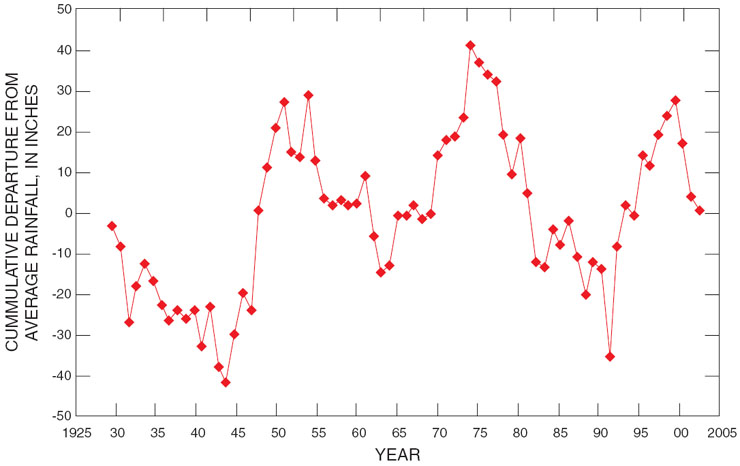
. For example, moderate declines were observed during periods when there was a net cumulative deficiency in rainfall (1929 to 1943, 1951 to 1962, 1974 to 1990, and 1999 to 2001). However, declines also were observed during periods of surplus rainfall (1944 to 1950 and 1963 to 1973), indicating that increased ground-water development tended to offset the effects of greater than normal rainfall. An exception, however, was from 1991 to 1998, when a net surplus of about 60 inches of rainfall produced a rise in water levels at some well locations. Although declines in water levels in the monitoring wells have occurred during the entire period of record, the rate of decline appears to have moderated since the late 1970s and early 1980s. The moderation in water-level declines seems to be related to the stabilization of water use in Duval and surrounding counties, which began in the early 1970s.
Figure 10. Cummulative departure from average rainfall at Jacksonville, Florida, 1929-2001. [
]