FGB Figures
To view an image:
Click on any image below to enlarge.
|
To download a higher resolution image:
PC users: Right-click image and select "Save Target As..."
Mac users: Press control & click or Click & hold, then
select "Download Image to Disk"
|
Flower Garden Banks
|
|
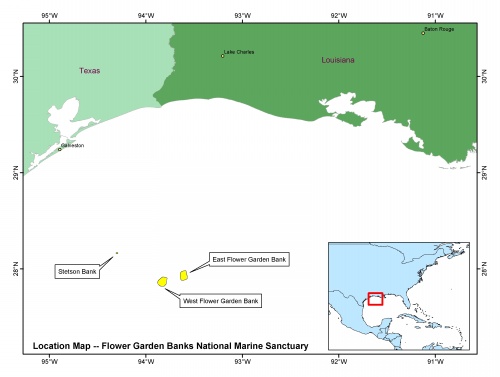
bounds wstglf - Location map of
the Flower Garden Banks National Marine Sancutary in the Northwestern
Gulf of Mexico.
Click figure to enlarge (167 kb). |
|
|
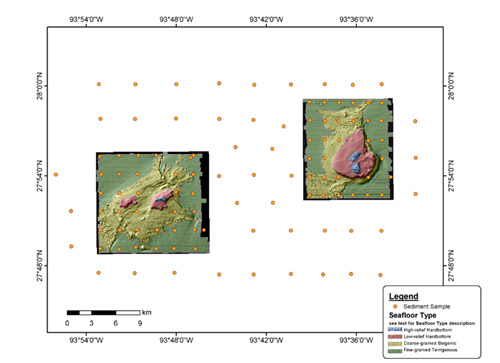
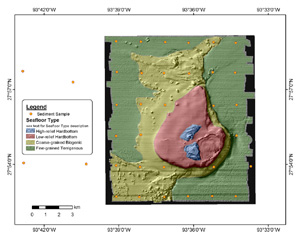
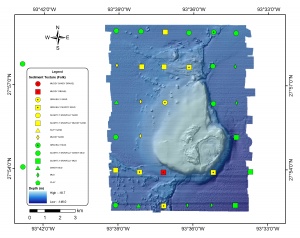
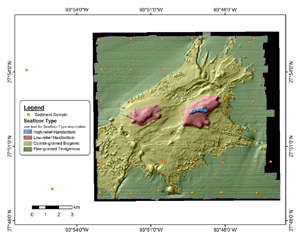
FGB_interp - Shaded relief maps
of the East & West Flower Garden Banks overlain by the sea-floor
type interpretation based on multibeam backscatter, multibeam
bathymetry and sediment grab samples.
Click figure to enlarge (188 kb). |
|
|
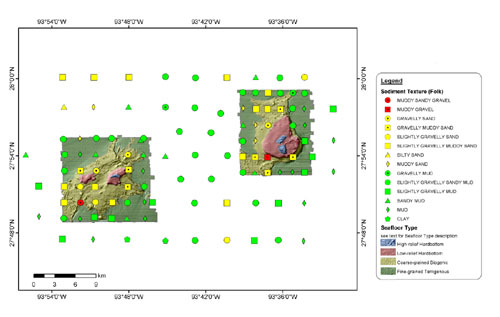
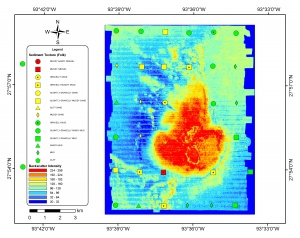
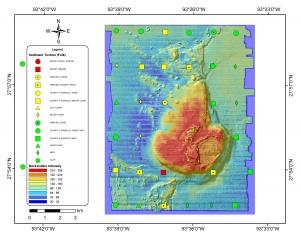
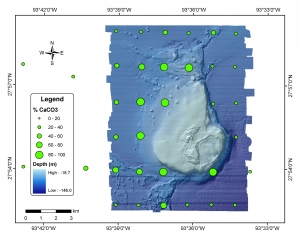
FGB_xih - Sediment type analysis
of samples from the Flower Garden Banks region. The sample locations
are overlayed on the bottom interpretation and multibeam bathymetry
based shaded relief.
Click figure to enlarge (296 kb). |
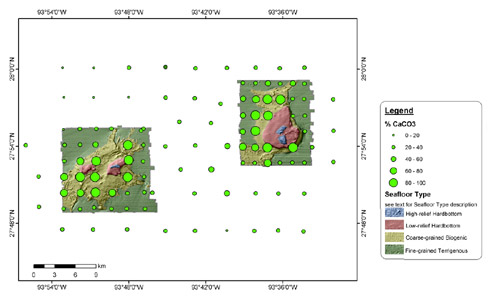 |
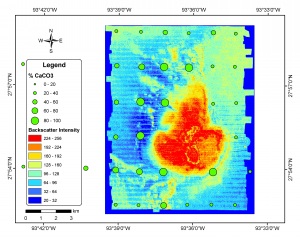
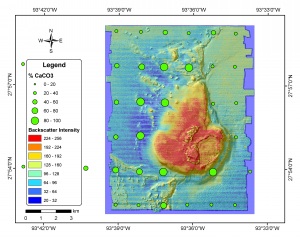
FGB_cih - CaCO3 analysis of samples from the Flower
Garden Banks region. The sample locations are overlayed on the bottom
interpretation and multibeam bathymetry based shaded relief.
Click
figure to enlarge (264 kb). |
East Flower Garden Bank
|
|
|
ef_basic
Mulitbeam backscatter with sample locations and 50m
contours.
Click figure to enlarge (314 kb).
|
ef_interp
Sea-floor interpretation based on multibeam backscatter,
multibeam bathymetry and sediment samples.
Click figure to enlarge (291 kb). |
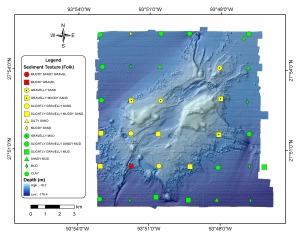
ef_x... - EFGB, Sediment Textures
of sea-floor samples |
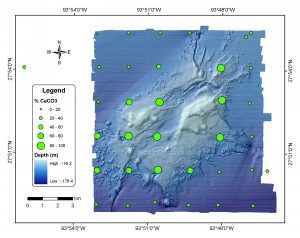
ef_c... - EFGB, % CaCO3 for the
sediment samples. |
|
|
|
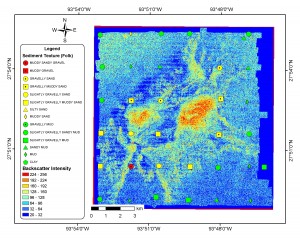
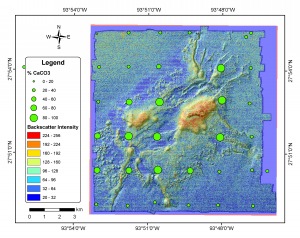
ef_xbs
Samples on multibeam backscatter.
Click figure to enlarge (627 kb). |
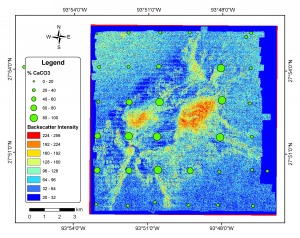
ef_cbs
Samples on multibeam backscatter.
Click figure to enlarge (570 kb). |
|
|
|
|
|
|
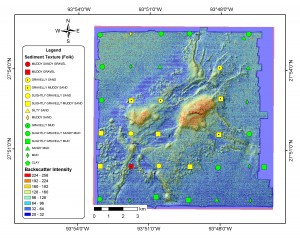
ef_xbsh
Samples on multibeam backscatter over the shaded relief.
Click figure to enlarge (547 kb). |
ef_cbsh
Samples on multibeam backscatter over the shaded relief.
Click figure to enlarge (496 kb). |
|
|
|
|
|
|
ef_xbyh
Samples on multibeam bathymetry over the shaded relief.
Click figure to enlarge (307 kb). |
ef_cbyh
Samples on multibeam bathymetry over the shaded relief.
Click figure to enlarge (276 kb). |
West Flower Garden Bank
|
|
|
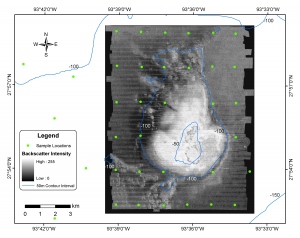
wf_basic
Mulitbeam backscatter with sample locations and 50m contours.
Click figure to enlarge (359 kb).
|
wf_interp
Sea-floor interpretation based on multibeam backscatter, multibeam
bathymetry and sediment samples.
Click figure to enlarge (339 kb). |
wf_x... - WFGB, Sediment Textures
of sea-floor samples |
wf_c... - WFGB, % CaCO3 for the
sediment samples. |
|
|
|
wf_xbs
Samples on multibeam backscatter.
Click figure to enlarge (849 kb). |
wf_cbs
Samples on multibeam backscatter.
Click figure to enlarge (812 kb). |
|
|
|
|
|
|
wf_xbsh
Samples on multibeam backscatter over the shaded relief.
Click figure to enlarge (720 kb). |
wf_cbsh
Samples on multibeam backscatter over the shaded relief.
Click figure to enlarge (689 kb). |
|
|
|
|
|
|
wf_xbyh
Samples on multibeam bathymetry over the shaded relief.
Click figure to enlarge (345 kb). |
wf_cbyh
Samples on multibeam bathymetry over the shaded relief.
Click figure to enlarge (317 kb). |
|
Notes about these figures:
These figures of the East and West Flower Garden Regions were
created using ArcMap 8.2 (part of ESRI's ArcGIS mapping software).
ArcGIS layer (.lyr) files are included within most of the zipped
data files (.zip) found on the data download page.
The zipped data files ferltxtr.shp, caco3.shp, ef_interp.shp
and wf_interp.shp also include ArcView legend files (.avl) which were
created using ArcView 3.2a.
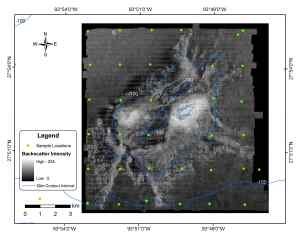
The East and West Flower Garden sediment texture figures
are a series of three figures for each area. The figures ef_xbs and
wf_xbs contain the shapefile ferltxtr.shp over the backscatter
intensity image for the specific areas. The backscatter intensity layer is
an 8-bit TIFF image, originally represented as a grayscale series of backscatter
intensity values of 0 to 255. For these figures a color ramp was used where
warm colors represent the higher backscatter values and cool colors represent
the lower backscatter values. The figures ef_xbsh and wf_xbsh
contain the ferltxtr.shp shapefile on the pseudo-colored backscatter
intensity draped over the shaded relief. The shaded relief was created by
converting the 5-meter multibeam bathymetry (Dartnell and Gardner, 1999) to
a hillshade grid using ArcMap's Spatial Analyst. The hillshade grids (ef_hlshd
and wf_hlshd) were created using Spatial Analyst's default settings
(Azimuth: 315; Altitude: 45; Z factor: 1). The figures ef_xbyh and
wf_xbyh contain the ferltxtr.shp shapefile on the 5-meter multibeam
bathymetry, which is then draped over the shaded relief. The bathymetry grid
has been color-coded according to depth, where light blues represent shallower
areas and the darker blue represents the deeper regions. For those figure
that include the shaded relief, the draped layer (bathymetry or backscatter)
is set to display as 50% transparent, allowing the underlying hillshade to
be seen and creating the illusion of textured relief.
The East and West Flower Garden %CaCO3 figures were created
in a similar manner to the one described above for the sediment texture figures.
The same layers for pseudo-colored backscatter intensity (ef_cbs and
wf_cbs), hillshade (ef_cbsh and wf_cbsh)and multibeam bathymetry
(ef_xbyh and wf_xbyh) were used in these figures beneath the
shapefile caco3.shp.
[an error occurred while processing this directive]
|