
The computer software used to collect and display the gamma-ray spectrometer data is the EG&G Ortec Maestro-32 (A65-B32) version 5.10 for Microsoft Windows 98 SE. The Maestro-32 software is used to collect 512 channels of data, allows for user-designated regions of interest (ROIs), and shows continuously updated spectra. The PC monitor in the image below shows a typical spectrum measured from a sample located beneath the detector within the lead castle. The 4 red peaks shown on the PC screen are, from left to right, the 137Cs, K, eU and eTh peaks. The cesium peak is used as a reference to detect instrument drift and the cesium source is located within the lead castle. The smaller window in the upper right corner of the PC screen shows an overall view of the same spectrum (peaks shown in yellow) with all 512 channels displayed. The main spectrum (in red) displays channels 68 through 386 in the image below. The ROIs for this spectrometer system are indicated by the red areas in the spectrum shown below, and are given in the table below.
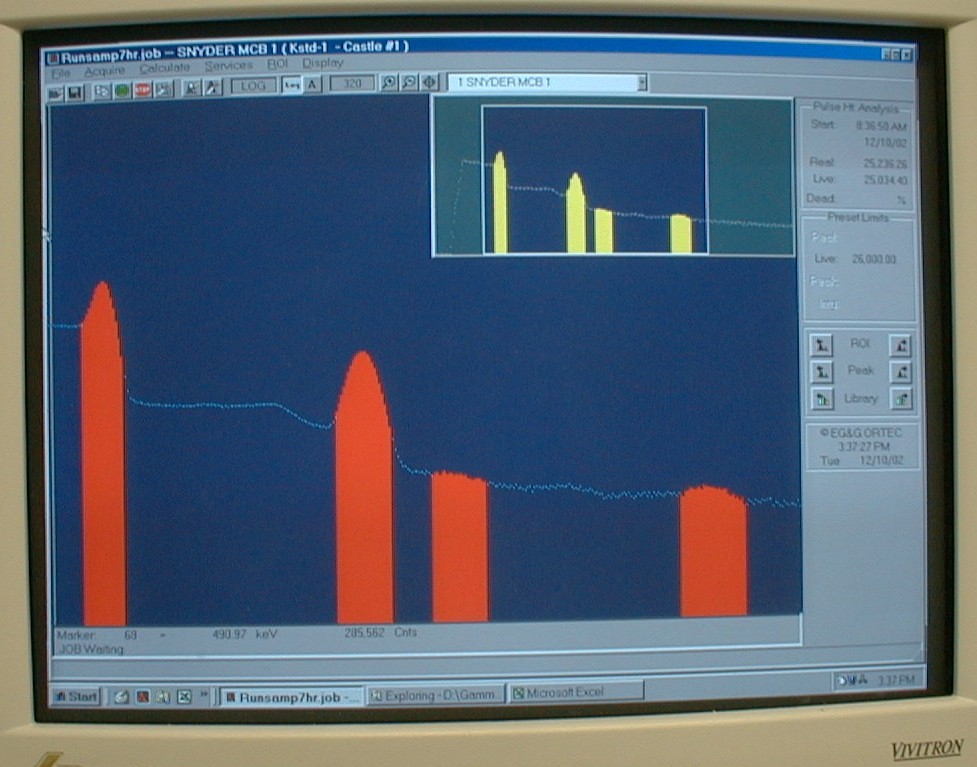
PC running Maestro-32 software showing a typical spectrum.
(Click on photo to view larger image in new window)
| Isotope | Channels (ROIs) | Energy Range (KeV) | Peak Energy (KeV) |
|---|---|---|---|
| Cs-137 | 82 - 98 | 597.43 - 719.11 | 661.62 |
| K-40 | 186 - 208 | 1388.31 - 1555.61 | 1460.75 |
| Bi-214 | 226 - 248 | 1692.50 - 1859.80 | 1764.51 |
| Tl-208 | 333 - 361 | 2506.19 - 2719.12 | 2614.47 |
Table showing regions of interest (ROIs), gamma-ray energy range, and peak gamma-ray
energy for each isotope measured by the system and shown in the image above.
Values for gamma-ray energies are expressed in KeV.
Top || Introduction || Software || Hardware || Construction || References || Photos || Data
For more information about this report contact: Stephen
L. Snyder or Joseph S. Duval
[an error occurred while processing this directive]