Geologic Variables
 |
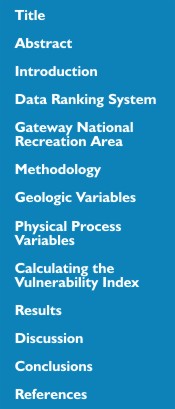
| Figure 4. Photos of the very high vulnerability barrier island geomorphology within Breezy Point District and Sandy Hook Unit. Click on figure for larger image. |
The geomorphology variable expresses the relative erodibility of different landform types (Table 1). These data were derived from orthophotographs (1994-2002) of Gateway NRA from NY and NJ (Table 2). In addition, field visits were made within the park to verify the geomorphologic classifications. The geomorphology of
 |
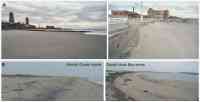
| Figure 5. Photos of the different geomorphology types within the Staten Island Unit. Click on figure for larger image. |
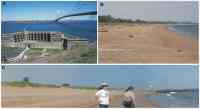
Gateway varies from very high vulnerability barrier spit and historic artificial fill to moderate vulnerability reworked glacial-fluvial deposits. Breezy Point and Sandy Hook were classified as very high vulnerability barrier spit geomorphology (Figure 4 A-B). The Staten Island park shoreline varied from very high vulnerability artificial fill at Great Kills Park to moderate vulnerability terminal moraine at Fort Wadsworth (Figure 2 and Figure 5 A-C).
 |
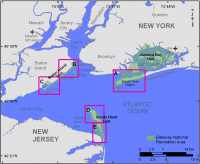
| Figure 2. Surficial geology map for Staten Island (Soren, 1988). Click on figure for larger image. |
Shoreline erosion and accretion rates for Gateway were calculated from existing shoreline data provided by USGS, New York State Department of State (Table 2). Shoreline rates of change (m/yr) were calculated at 200 m intervals (transects) along the coast using Digital Shoreline Analysis System software (http://woodshole.er.usgs.gov/project-pages/dsas/) to derive the rate of shoreline change over time. The rates for each transect within a 1-minute grid cell were averaged to determine the shoreline change value used here, with positive numbers indicating accretion and negative numbers indicating erosion. Shoreline change rates on Gateway range from greater than 2 m/yr of accretion (very low vulnerability) to greater than 2 m/yr of erosion (very high vulnerability) (Figure 6 A-E).
The determination of regional coastal slope identifies the relative vulnerability of inundation and the potential rapidity of shoreline retreat because low-sloping coastal regions should retreat faster than steeper regions (Pilkey and Davis, 1987). The regional slope of the coastal zone was
 |
| Figure 6. Historic shoreline position index map. Click on figure for larger image. |
calculated from a grid of topographic and bathymetric elevations extending 10 km landward and seaward of the present-day shoreline. Elevation data were obtained from the National Geophysical Data Center (NGDC) as gridded topographic and bathymetric elevations at 0.1 meter vertical resolution for 3 arc-second (~90 m) grid cells. Regional coastal slopes for Gateway fall within the high vulnerability (4) to very high vulnerability (5) category (Table 1).
Back to Top