Discussion
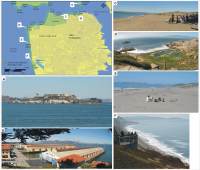
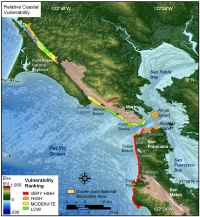
The data within the coastal vulnerability index (CVI) show variability at different spatial scales (Figure 11). However, the ranked values for the physical process variables vary less over the extent of the shoreline. The value of the relative sea-level rise variable is between low and moderate vulnerability. The significant wave height vulnerability is very low to high. The tidal range is mostly high vulnerability (1.0- 2.0 m) for all of GGNRA, with the exception of Bolinas Lagoon (very high vulnerability), and therefore contributes little to the variability of the CVI
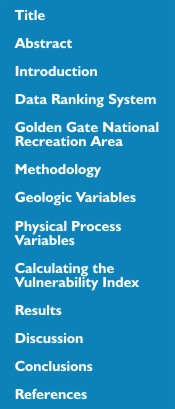
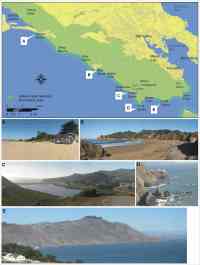
The geologic variables show the most spatial variability and thus have the most influence on CVI variability (Figure 11). Geomorphology in the park includes very high vulnerability sandy beach shoreline, high vulnerability gravel beaches and engineered structures, moderate vulnerability alluvium and unconsolidated cliffs, and low and very low vulnerability rock and cliff features (Figure 3 A-E and Figure 4 A-G). Vulnerability assessment based on shoreline change is mostly moderate vulnerability with a few small areas of high vulnerability (Figure 6). Regional coastal slope is in the very low to very high vulnerability range for GGNRA.
The most influential variables in the CVI are geomorphology, coastal slope, and mean significant wave height; therefore they may be considered the dominant factors controlling how GGNRA will evolve as sea level rises.
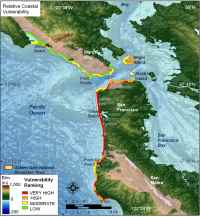
Although there is parkland along Tomales Bay that lies within the legislative boundary of GGNRA, the area is managed by Point Reyes National Seashore. From a GGNRA management perspective there was a need to create another coastal vulnerability map that excludes the Tomales bay region from the rest of the vulnerability assessment. The map result of this analysis is shown in Figure 13. This map is considered supplemental for park managers and Figure 11 displays the results of the CVI analysis that this report is based upon.