Geologic Variables
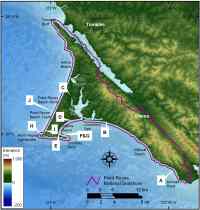
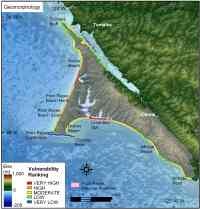
The geomorphology variable expresses the relative erodibility of different landform types (Table 1). These data were derived from oblique aerial photography of the California coast (http://www.californiacoastline.org/). In addition, field visits were made within accessible locations of the park to verify the geomorphologic classification (Figure 4 A-J and Figure 5). Point Reyes contains areas of several different geomorphologic features, including low to very low vulnerability granitic, sandstone, and conglomerate cliffs, moderate vulnerability alluvium and beach and dune deposit bluffs, and high and very high vulnerability gravel and sand beaches and spits (Figure 5) (Galloway, 1977; Clark and Brabb, 1997).
 |
 |
| Figure 4A-J. Index map of geomorphologic features within Point Reyes National Seashore. Click on figure for larger image. |
Figure 5. Coastal Geomorphology for Point Reyes National Seashore. Click on figure for larger image. |
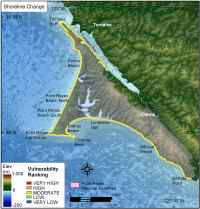
Shoreline erosion and accretion rates for Point Reyes National Seashore were calculated from data provided by the USGS National Assessment of Coastal Change Hazards project (C.J. Hapke and others, written commun., 2004) (Table 2). Shoreline change (m/yr) was calculated at 50 m intervals (transects) along the coast using Digital Shoreline Analysis System (DSAS) software (http://woodshole.er.usgs.gov/project-pages/dsas/) to derive the rate of shoreline change from 1880 -1998. The change rates for each transect within a 1-minute grid cell were averaged to determine the shoreline change value used here, with positive numbers indicating accretion and negative numbers indicating erosion. Shoreline change rates within Point Reyes National Seashore all fell within +1 to -1 m/yr (moderate vulnerability) (Figure 6).
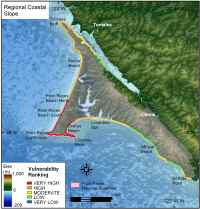
Regional coastal slope is an indication of the relative vulnerability to inundation and the potential rapidity of shoreline retreat because low-sloping coastal regions should retreat faster than steeper regions (Pilkey and Davis, 1987). The regional slope of the coastal zone was calculated from a grid of topographic and bathymetric elevations extending 10 km landward and seaward of the shoreline. Elevation data were obtained from the National Geophysical Data Center (NGDC) as gridded topographic and bathymetric elevations at 0.1-meter vertical resolution for 90-meter grid cells. Regional coastal slopes for Point Reyes fell within the very low to very high vulnerability category (< 4.55% - > 14.7%) (Figure 7).
 |
 |
| Figure 6. Shoreline change rates for Point Reyes National Seashore. Click on figure for larger image. |
Figure 7. Regional coastal slope for Point Reyes National Seashore. Click on figure for larger image. |
Back to Top