U.S. Geological Survey Open-File Report 2007-1373
High-Resolution Geologic Mapping of the Inner Continental Shelf: Cape Ann to Salisbury Beach, Massachusetts

|
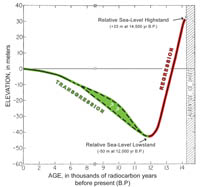
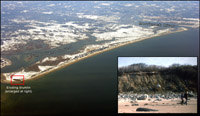
This report presents high-resolution maps and spatial data for the seafloor offshore of Massachusetts, between Cape Ann and Salisbury Beach. Approximately 325 km² of the inner continental shelf was mapped with a focus on water depths less than 100 m (fig. 1.1). The maps are the third in a series (Barnhardt and others, 2006; Ackerman and others, 2006) produced by a cooperative mapping program of the U.S. Geological Survey (USGS) and the Massachusetts Office of Coastal Zone Management (CZM). The maps are based on marine geophysical data, sediment samples, and bottom photography obtained on two research cruises in 2004 and 2005. The primary objective of this cooperative program is to develop geologic information for management of coastal and marine resources. Accurate maps of seafloor geology are important first steps toward protecting fish habitat, delineating marine reserves, and assessing environmental changes caused by natural or human impacts. The maps also provide a geologic framework for scientific research, industry, and the public. The outline of this report is shown in the navigation bar along the left-hand margin. This is section 1, the introduction. Section 2 briefly describes the mapping products in this report and has links to large-format map sheets that can be viewed on line or downloaded. Section 3 fully describes the data-collection, processing, and analysis procedures used to create the map products. Section 4 examines the geologic framework and late Quaternary evolution of the region. Appendixes 1-4 contain all geophysical and sample data collected in the study. SettingThe Cape Ann-Salisbury Beach study area lies in the western Gulf of Maine offshore of the northeastern Massachusetts coast (fig. 1.1). The general configuration of the shoreline and inner shelf is controlled by the structure and composition of the regional bedrock framework. Late Quaternary glaciation and relative sea-level change have been the major processes shaping the coast and inner shelf in the region. Isostatic rebound following retreat of the Laurentide Ice Sheet has dominated the history of relative sea level and caused profound changes in the position of the coastline. A 10-km wide zone of the inner shelf has been extensively reworked by a transgression, a regression, and a second transgression over the last 14,500 years (fig. 1.2). The Merrimack River, which drains approximately 12,900 km² in northeastern Massachusetts and south-central New Hampshire, discharges into the Gulf of Maine north of Cape Ann (fig. 1.1). The river catchment is dominated by granitic plutons in the White Mountains. The plutons have weathered to produce extensive sandy glacial deposits. Sandy sediment has been transported by the river to the coast at Plum Island and subsequently reworked in a southeasterly alongshore direction as a result of strong waves out of the northeast (FitzGerald and others, 2002). Sediment supplied by the river and derived from erosion of coastal and inner shelf deposits has built the longest chain of sandy barriers in the Gulf of Maine (FitzGerald and others, 1994). The barrier islands and spits stretch approximately 34 km from Ipswich Bay to the New Hampshire border and are pinned to bedrock or glacial promontories (fig. 1.3). Backbarrier environments consist primarily of marsh and tidal creeks that commonly open to small bays near the inlet openings (Smith and FitzGerald, 1994). Mean tidal range is 2.5 m, with a spring tidal range of about 2.9 m. Wind directions vary seasonally with dominant winds from the southwest during spring and summer and from the northwest during fall and winter. Summer wave conditions are generally low energy with southerly swells. Tropical cyclones or hurricanes are rare, but extratropical storms that blow hard out of the northeast, locally known as Northeasters, strike the coast every year during the fall and winter. The storms produce strong winds and large waves that cause extensive erosion along the east-facing shorelines of Massachusetts. Storm winds blowing out of the southeast and southwest are less common and have less impact on the coast because of the sheltering effect of Cape Ann.
|

![]() U.S. Department of the Interior |
U.S. Geological Survey
U.S. Department of the Interior |
U.S. Geological Survey
URL: https://pubsdata.usgs.gov/pubs/of/2007/1373/html/intro.html
Page Contact Information: Contact USGS
Page Last Modified: Wednesday, 07-Dec-2016 21:00:27 EST