U.S. Geological Survey Open-File Report 2008-1206
Coastal Change Along the Shore of Northeastern South Carolina: The South Carolina Coastal Erosion Study
Return to: Title and Abstract » Table of Contents » Section 1 » Section 2 » Section 3 » Section 4 » Section 5 » Section 6 » Acknowledgments » References » List of Figures » Acronymns » Glossary |
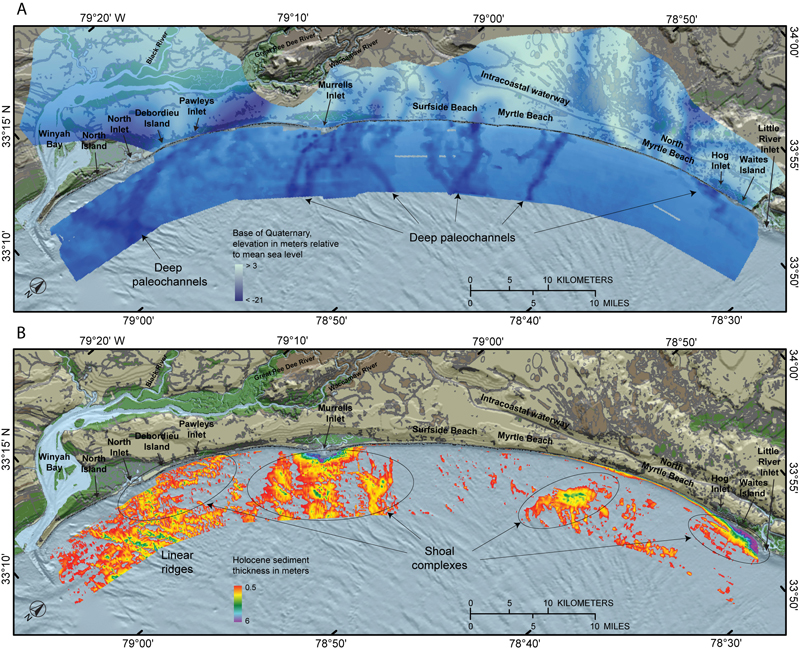
Figure 3.5. A) Map showing topography on top of Cretaceous and Tertiary sedimentary rocks (base of Quaternary elevation) beneath the Grand Strand. Elongate depressions (shown in the darkest blue colors) crossing this generally low-relief surface represent paleochannels incised by fluvial systems since the Late Pliocene (about 2.1 million years ago). The largest paleochannels were produced by the Pee Dee River, which has occupied multiple courses across the region during the geologic past (see Figure 3.9). Modified from Putney and others (2004) and Baldwin and others (2007). >, higher than; <, deeper than. B) Map showing thickness of Holocene inner-shelf sediments, which generally increase in abundance from north to south. Over large areas Holocene sediments are less than 0.5 m (1.6 m) thick or absent. The largest accumulations (up to 6 m or 20 ft thick) generally form shoal complexes that extend seaward from tidal inlets. A notable exception is a north-south oriented, shore-oblique shoal offshore of Myrtle Beach. Modified from Baldwin and others (2007). The background shaded-relief imagery was constructed by using the NOAA-NGDC coastal relief model and USGS hydrography data. [Click here for high-resolution image.]
 |