U.S. Geological Survey Open-File Report 2009-1042
National Assessment of Historical Shoreline Change: A Pilot Study of Historical Coastal Bluff Retreat in the Great Lakes, Erie, Pennsylvania
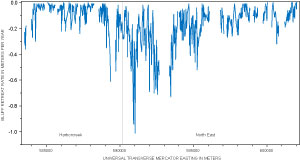
The coastline of Lake Erie is divided politically into seven townships and the City of Erie (fig. 3), which extend from Springfield Township in the west to North East Township on the east, next to the Pennsylvania-New York border. For the pilot study, bluff-retreat rates were assessed separately for two sections of coast, defined by the availability of 2006 versus 1998 lidar data. Wherever possible, the most recent data were used. However, no lidar data are available for 2006 for most of Harborcreek Township (8 of 11 km) and all of North East Township. This portion of the coastline is referred to in the discussion as the “eastern section,” and the rates presented are 60-year assessments, from 1938 to 1998. The end-point rate was used because there were only two dates of bluff edges available. The bluff-retreat rates for the western section, composed of the remaining five townships (Springfield, Girard, Fairview, Millcreek, and Lawrence Park) and 3 km of Harborcreek Township, are assessed over a 68-year time period, from 1938 to 2006. No bluff retreat data are presented for the City of Erie, as it is a heavily developed and engineered coastline with few measureable bluffs. For the eastern section of the Lake Erie, Pa., coastline, the average bluff-erosion rate was -0.2 ± 0.1 m/yr, which is equal to an average retreat of 12 m over the 60-year time period of the analysis (table 1). The eastern section is 22 km in length but because there are many data gaps, retreat rates were calculated along only 4.7 km. The rates of bluff retreat are highest in the central portion of the section, where the maximum rate of -1.0 ± 0.1 m/yr was measured (fig. 11). The highest rates are found along a stretch of coast in the western 6 km of North East Township. The actively eroding bluffs (fig. 2) are in areas where the land use on the top of the bluff is predominantly agricultural, suggesting that irrigation may, in part, be responsible for the higher rates. The active bluffs, slump deposits, and headscarps are readily visible on Google Earth satellite imagery (http://earth.google.com/).
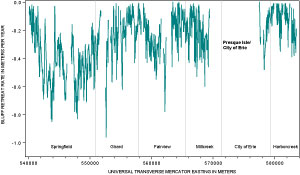
The western section is a total of 40 km in length along which 68-year bluff-retreat rates were generated for 27 km of coast. There is a large data gap extending from Presque Isle in Millcreek Township to the eastern boundary of the City of Erie (fig. 3). The average rate of bluff retreat in the western section is -0.3 ± 0.1 m/yr (table 1), and rates are consistently higher west of Presque Isle (fig. 12). The highest rate in the western section, -1.0 ± 0.1 m/yr, is in western Girard Township just east of several groins. Additionally, a large portion of the Springfield Township bluffs has high rates of retreat (0.6–0.8 m/yr). Predominant littoral transport rates along the Lake Erie, Pa., coast are east to west. The higher rates of erosion in these areas are likely related to the impoundment of littoral sediment behind the nearby upcoast Conneaut Harbor jetties and, more locally, groin fields. The trapping of these sediments essentially eliminates the source of protective beach material for the downcoast bluffs. The trend of lower erosion rates with distance from the harbor jetties is additional support for the influence of the jetties on the coastal system. |

![]() U.S. Department of the Interior |
U.S. Geological Survey
U.S. Department of the Interior |
U.S. Geological Survey
URL: https://pubsdata.usgs.gov/pubs/of/2009/1042/html/retreat_rates.html
Page Contact Information: Contact USGS
Page Last Modified: Monday, 03-Jun-2019 11:37:06 EDT