Skip past header information
USGS - science for a changing world

U.S. Geological Survey Open-File Report 2009-1151

Continuous Resistivity Profiling and Seismic-Reflection Data Collected in 2006 from the Potomac River Estuary, Virginia and Maryland


Continuous Resistivity Profile Previews

Skip past contents information

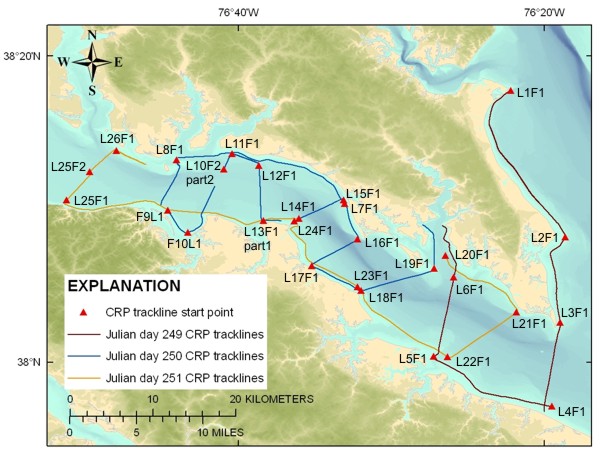
The table below contains previews of the CRP data processed using the measured water resistivity value (WRES in ohm-m). Both the EarthImager 2D JPEG image and the MATLAB JPEG image of each processed file are presented. In addition, the trackline map below is a "clickable" map. By clicking on a line name, a new window will open with the processed images from that particular line segment. This new window will contain the MATLAB JPEG image as well as a reduced version of the EarthImager 2D JPEG image (short version). The beginning of each line is marked with a triangle on the map. The left side of the associated JPEG image represents the beginning of the line and corresponds to the triangle on the map. Julian day 249 is September 6, 2006; Julian day 250 is September 7, 2006; and Julian day 251 is September 8, 2006.

Trackline map of processed CRP lines collected in the Potomac River Estuary in 2006. Line names provide hotlinks to the JPEG profiles. Link to line 1 Matlab and EarthImager JPEG profiles. Link to line 2 Matlab and EarthImager JPEG profiles. Link to line 3 Matlab and EarthImager JPEG profiles. Link to line 4 matlab and EarthImager JPEG profiles. Link to line 5 Matlab and EarthImager JPEG profiles. Link to line 6 Matlab and EarthImager JPEG profiles. Link to line 7 Matlab and EarthImager JPEG profiles. Link to line 8 Matlab and EarthImager JPEG profiles. Link to line 9 Matlab and EarthImager JPEG profiles. Link to line 10, file 1 Matlab and EarthImager JPEG profiles. Link to line 10, file 2, part 2 Matlab and EarthImager JPEG profiles. Link to line 11 Matlab and EarthImager JPEG profiles. Link to line 12 Matlab and EarthImager JPEG profiles. Link to line 13, file 1, part 1 Matlab and EarthImager JPEG profiles. Link to line 14 Matlab and EarthImager JPEG profiles. Link to line 15 Matlab and EarthImager JPEG profiles. Link to line 16 Matlab and EarthImager JPEG profiles. Link to line 17 Matlab and EarthImager JPEG profiles. Link to line 18 Matlab and EarthImager JPEG profiles. Link to line 19 Matlab and EarthImager JPEG profiles. Link to line 20 Matlab and EarthImager JPEG profiles. Link to line 21 Matlab and EarthImager JPEG profiles. Link to line 22 Matlab and EarthImager JPEG profiles. Link to line 23 Matlab and EarthImager JPEG profiles. Link to line 24 Matlab and EarthImager JPEG profiles. Link to line 25, file 1 Matlab and EarthImager JPEG profiles. Link to line 25, file 2 Matlab and EarthImager JPEG profiles. Link to line 26 Matlab and EarthImager JPEG profiles.

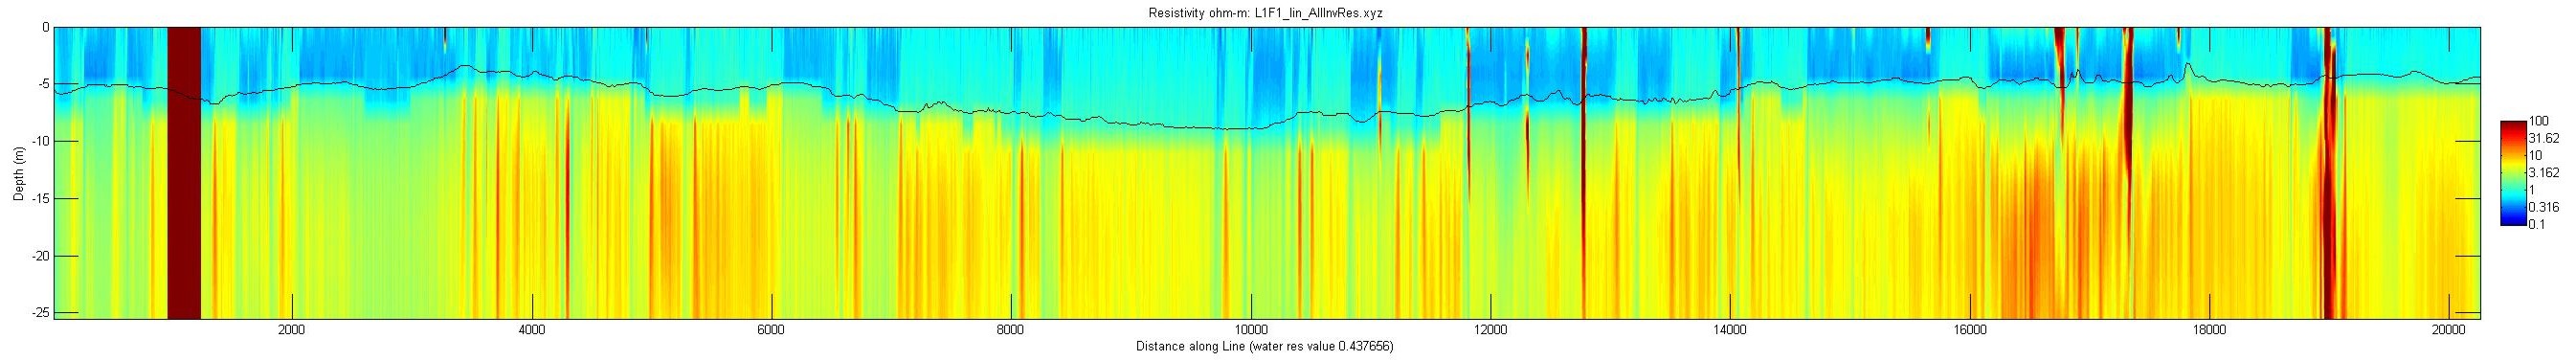
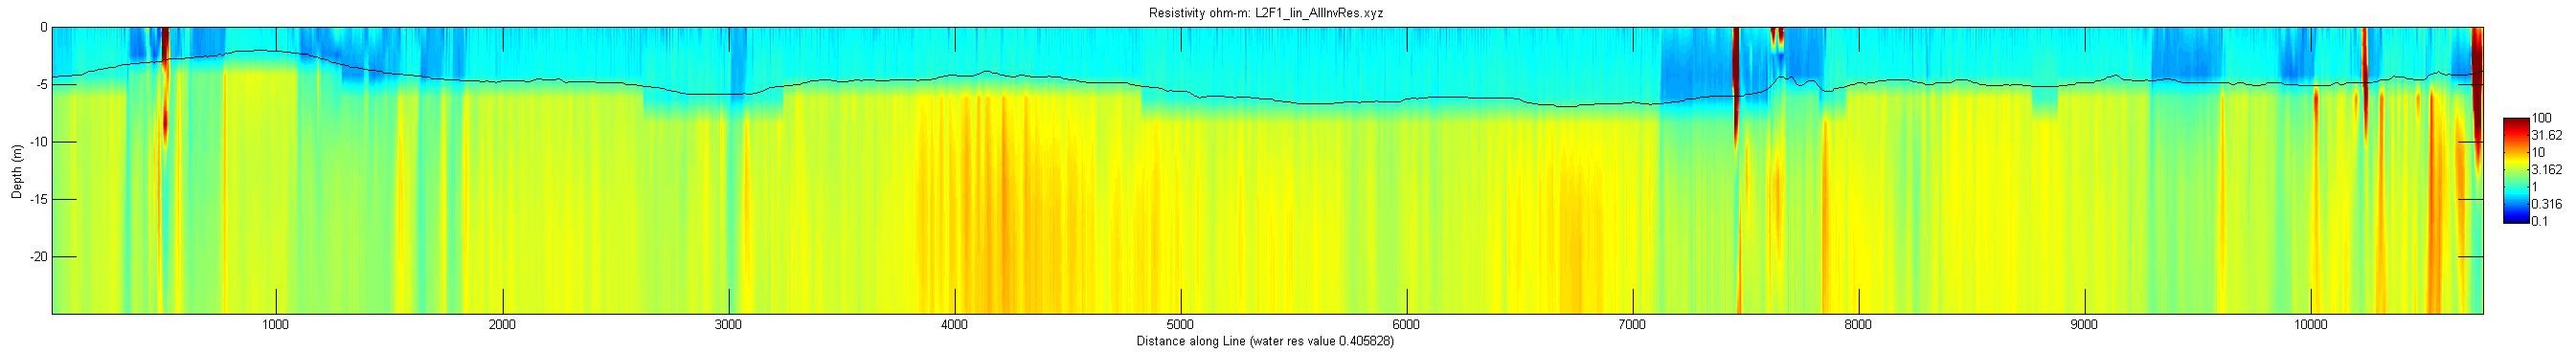
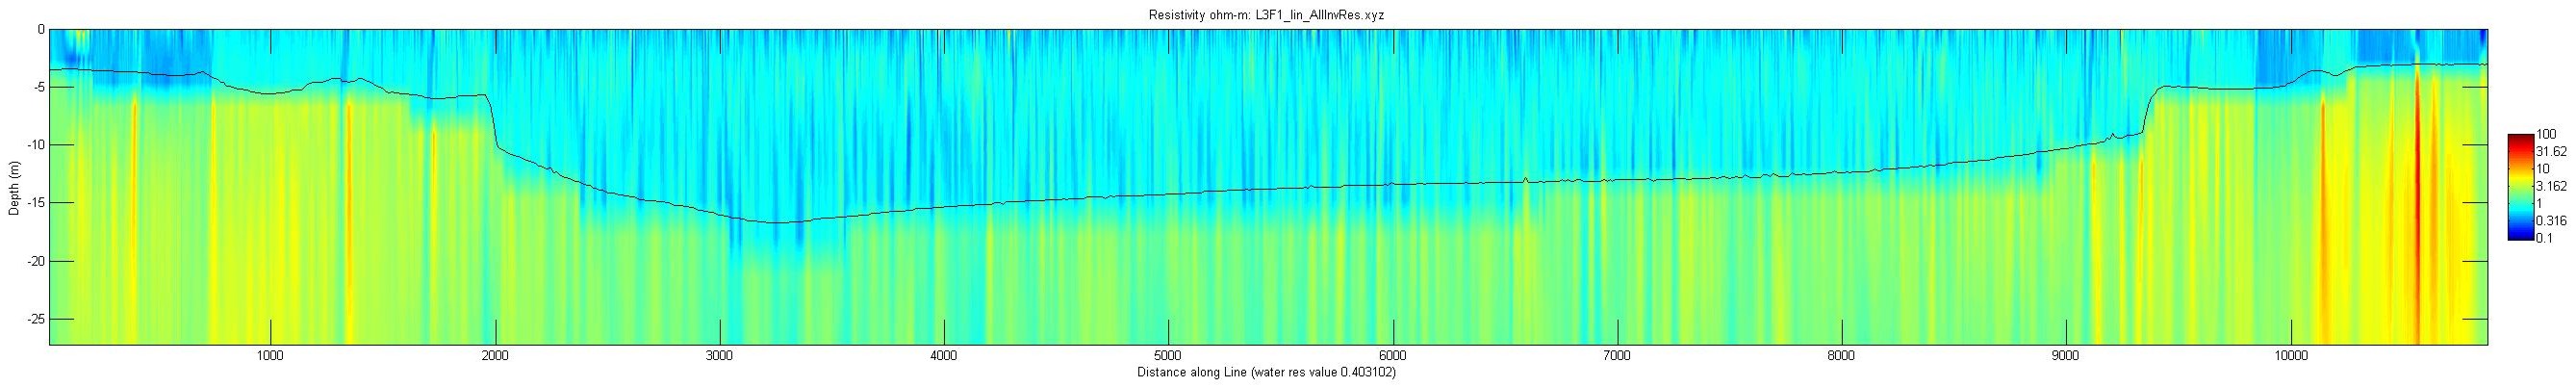
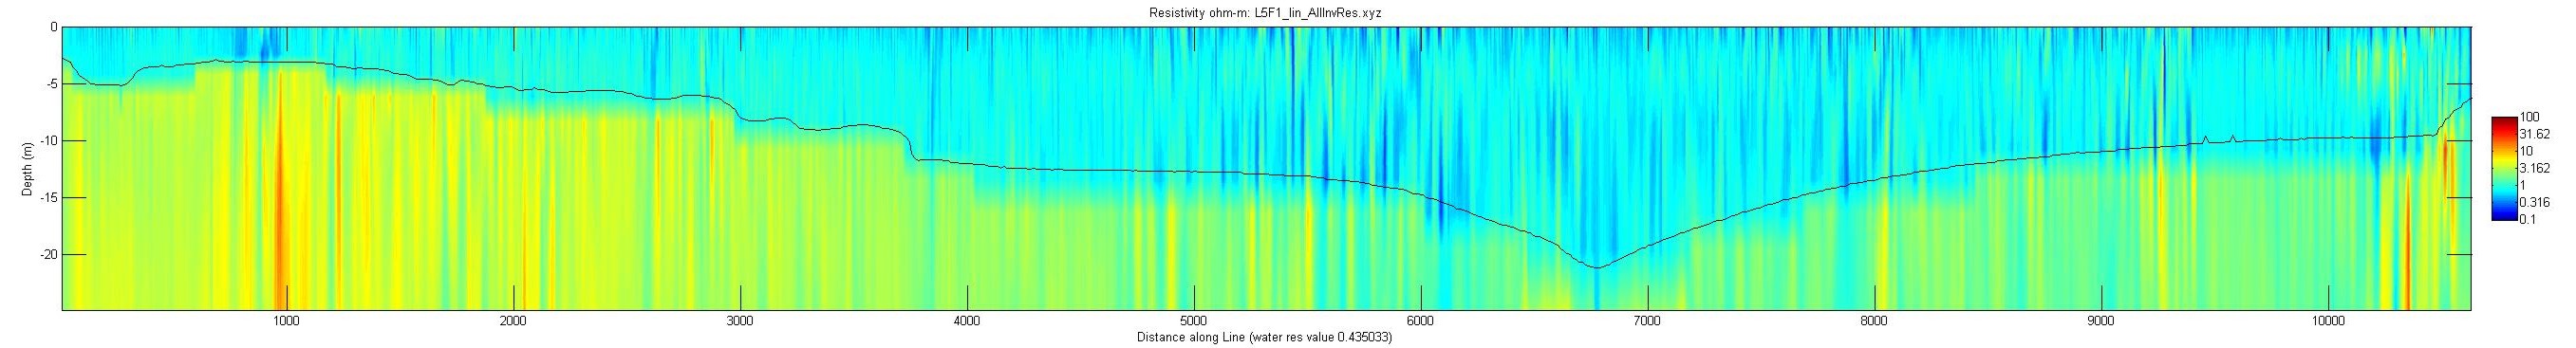
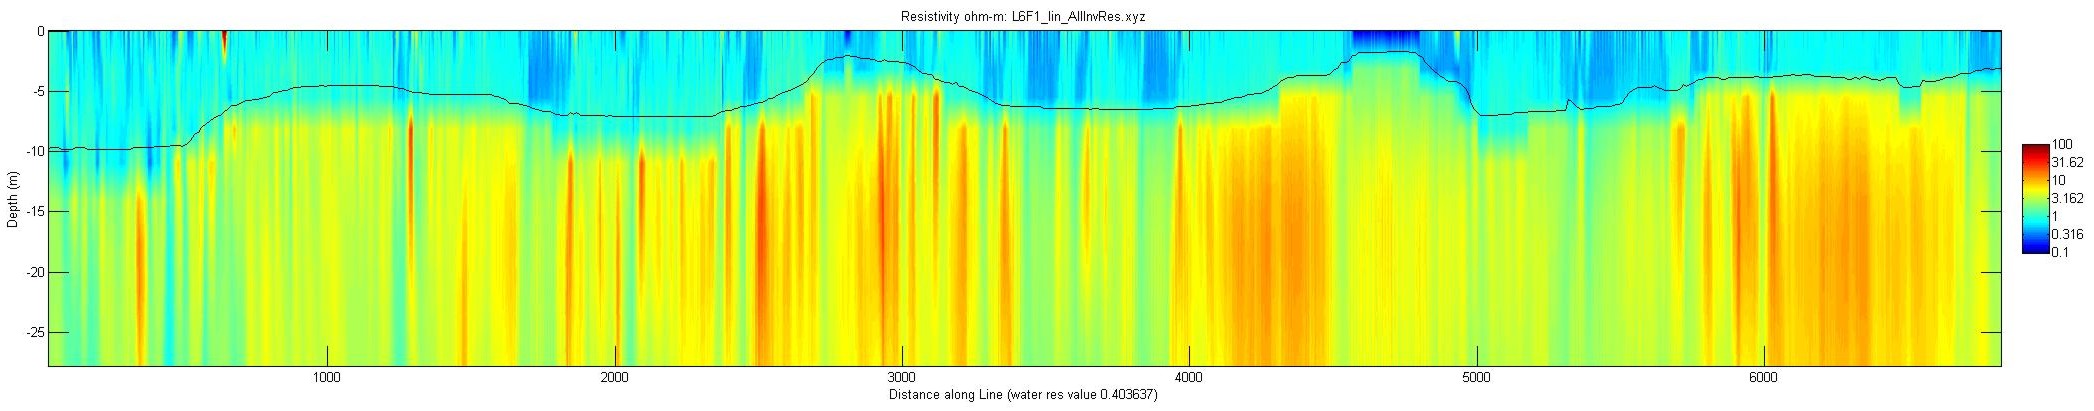
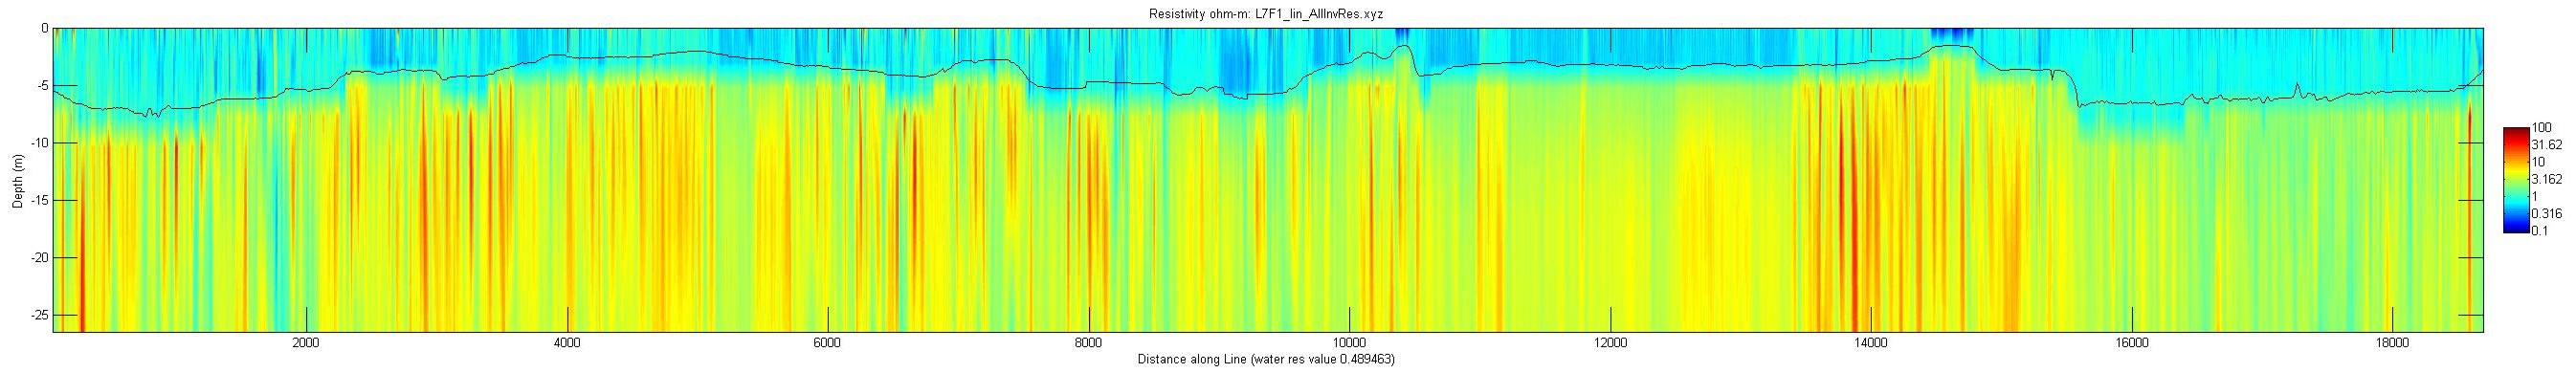
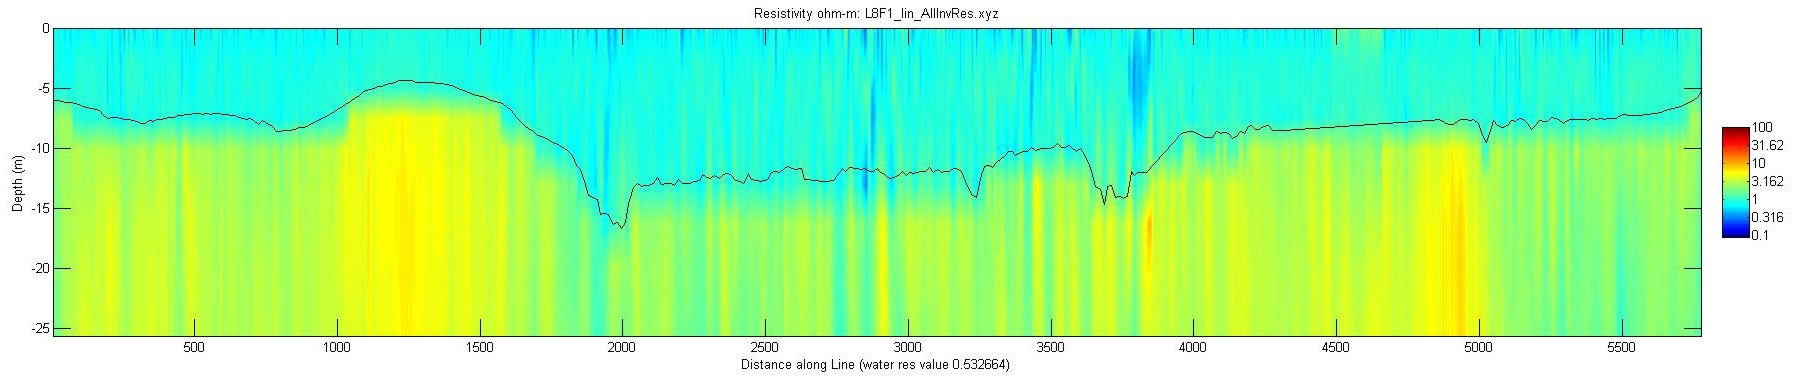
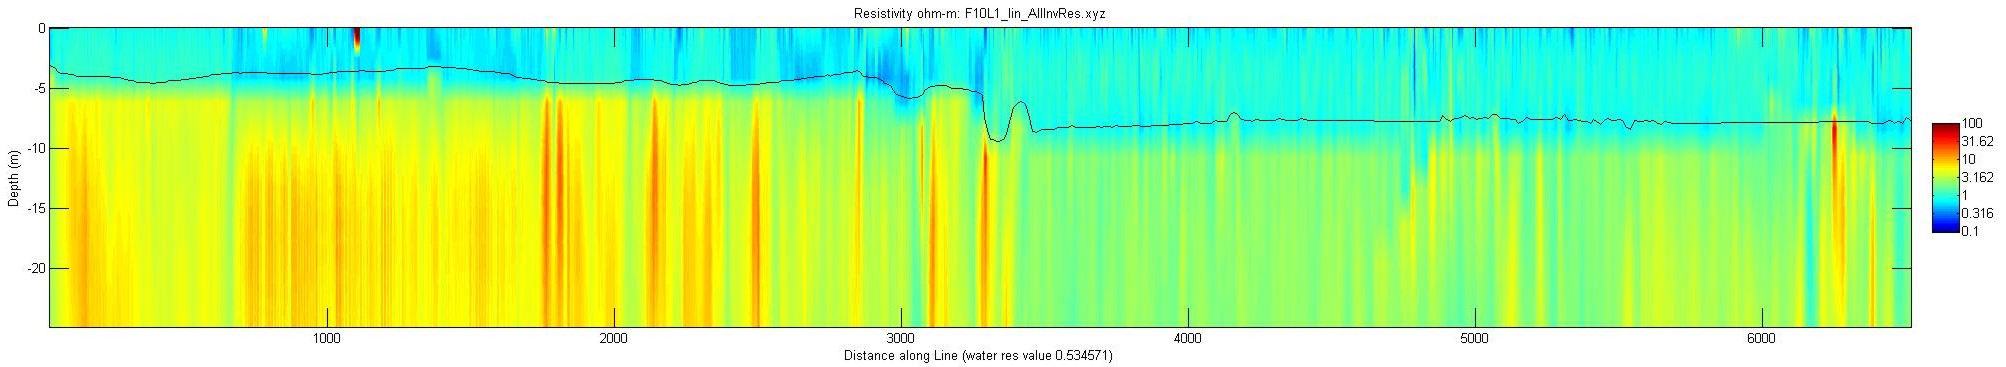
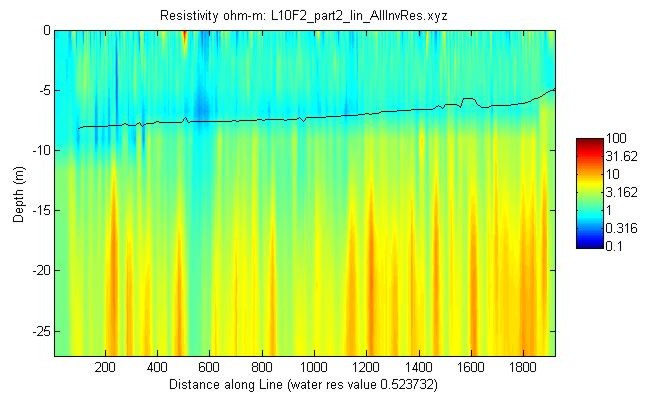
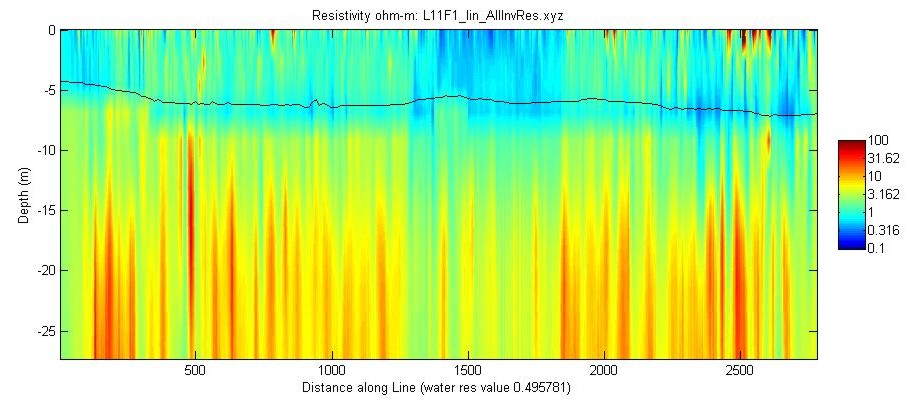
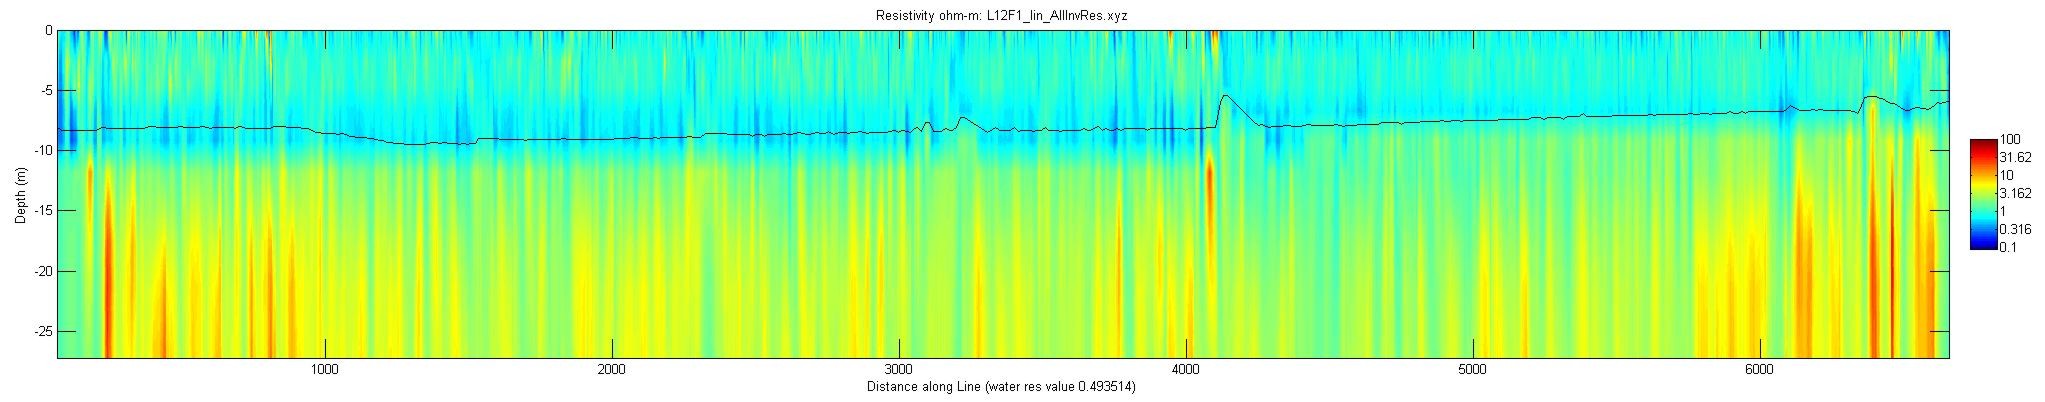
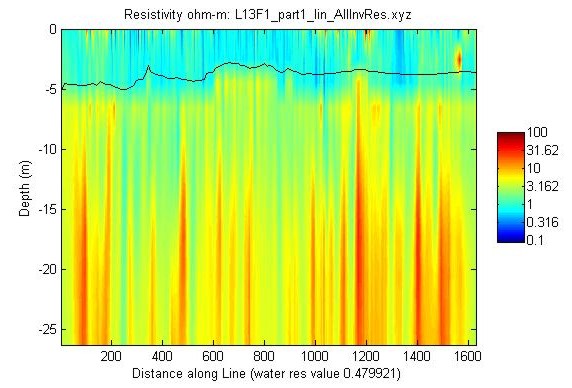
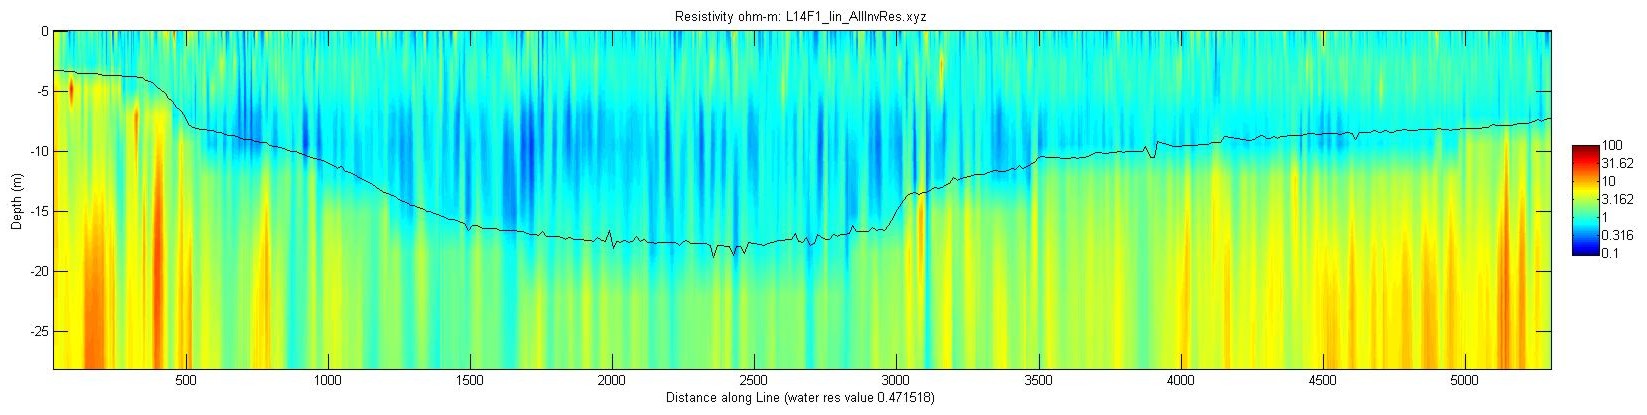
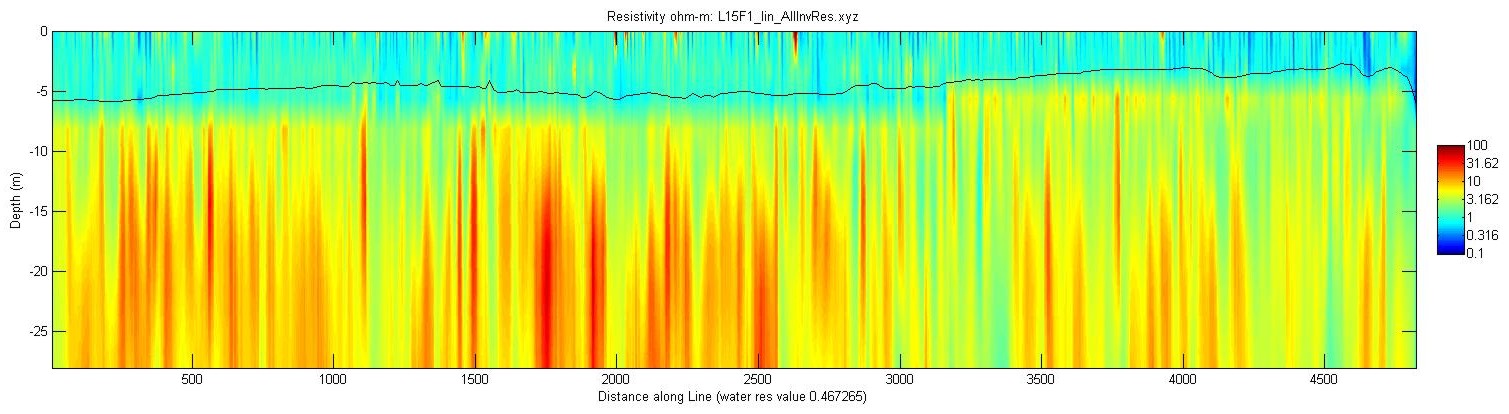
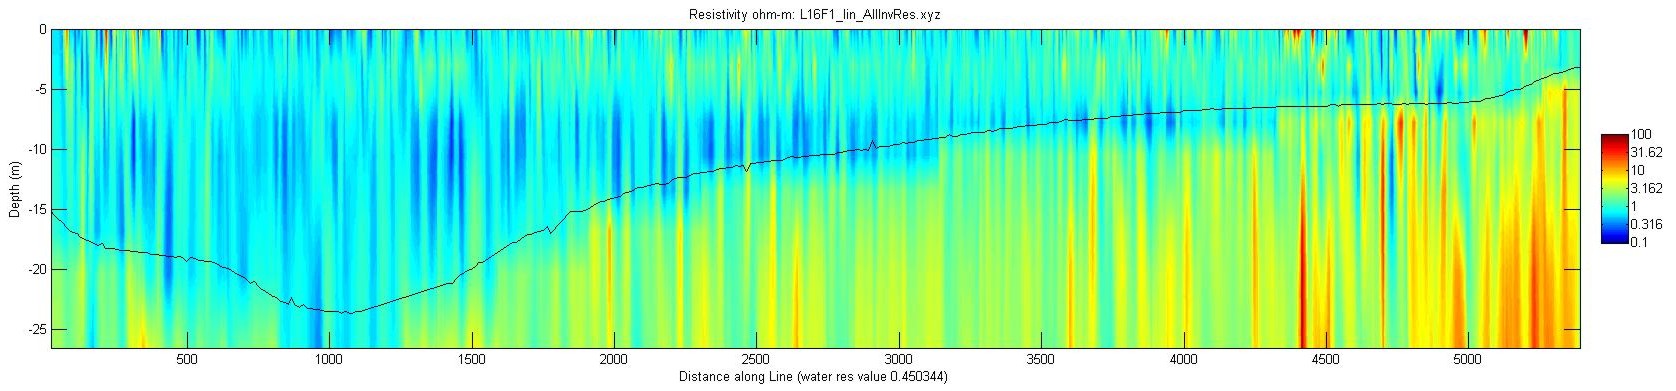
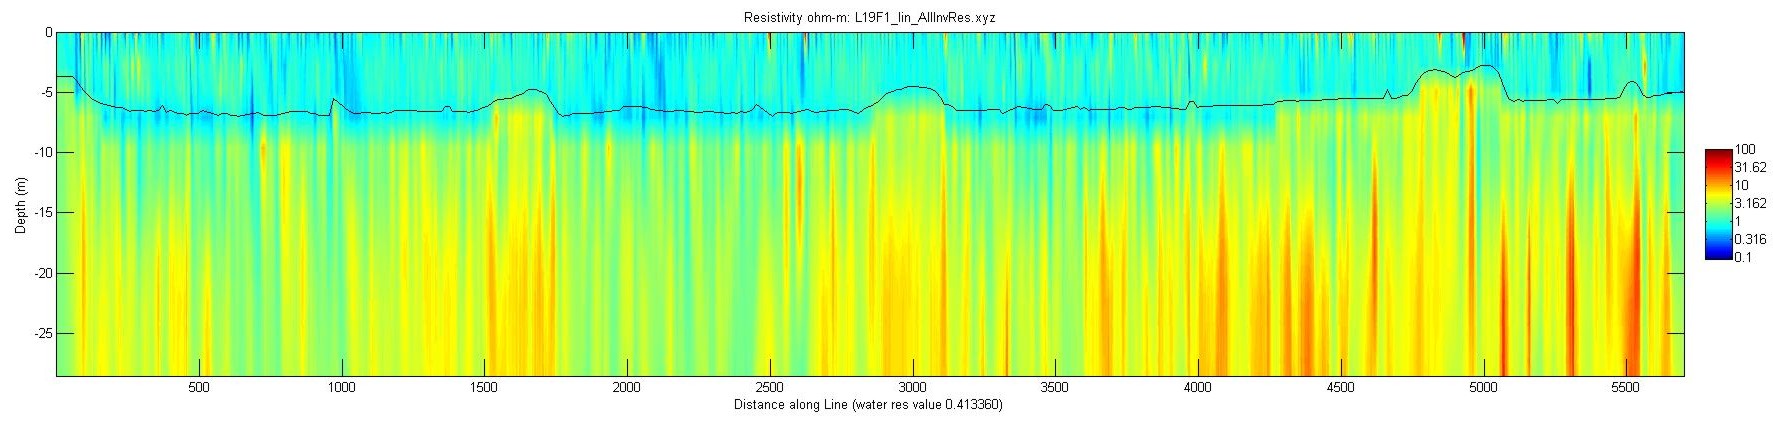
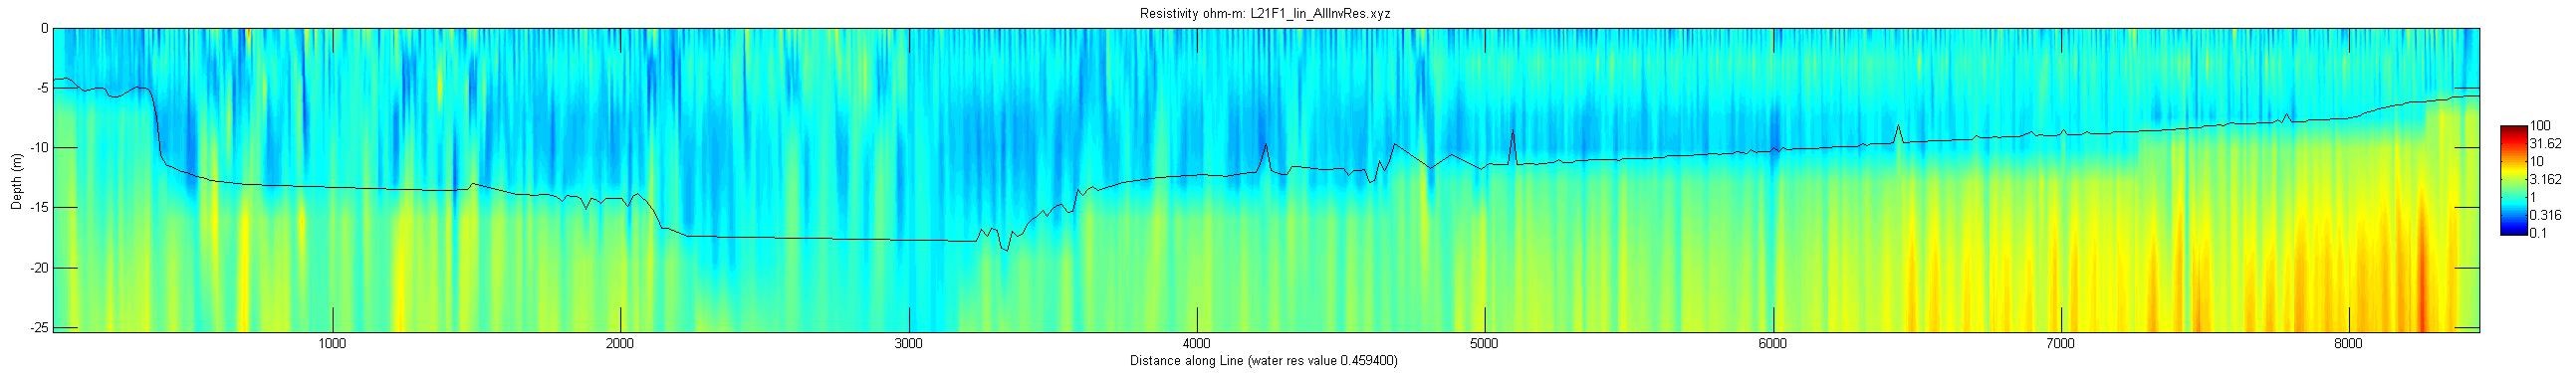
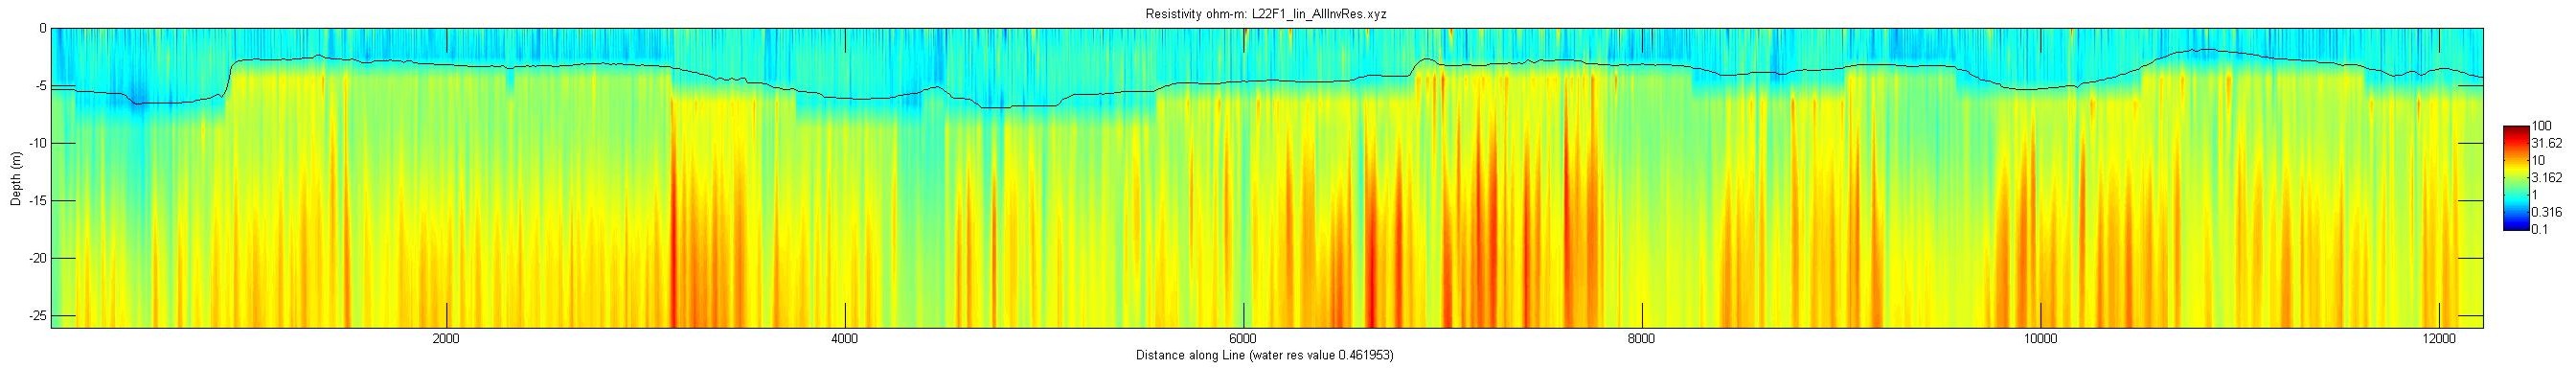
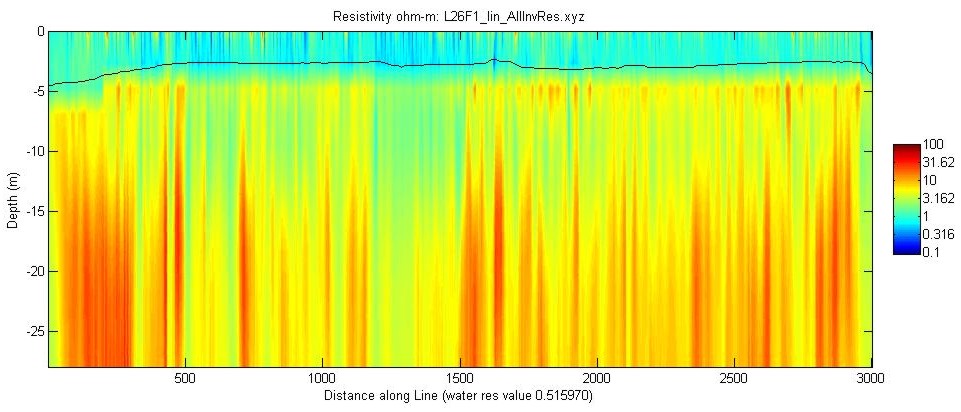
Preview of Profiles - click individual images to see full-size JPEG images of the profile. For the EarthImager 2D versions, the long version of the profile is available. All of the profiles are available for download from the Data Catalog page.

In the EarthImager 2D version, the white line in the image represents the water depth as measured by the fathometer. In the MATLAB-generated JPEG images, the water depth is represented by a black line. The JPEG images resulting from the EarthImager 2D processing were saved with the default color scale generated by the software. This color scale ranges from blues to reds with reds representing the higher resistivity values corresponding to fresher (less saline) groundwater. Each individual image has the scale maximized for the range of resistivity values in that dataset. The MATLAB versions of the JPEG images use a common color scale for all the files to facilitate profile comparison. For these images, the polarity of the color scheme is the same as that of the EarthImager 2D JPEGs in that the colors range from blue to red with reds indicating higher resistivity values. In the MATLAB version, the X-axis represents distance along line in meters. The EarthImager 2D version X-axis units are latitude and longitude (position) along line. On the second and third days of surveying, the temperature information was also available and is included with the resistivity profile.


EarthImager version MATLAB version

Sept. 6, 2006: Line L1F1, WRES = 0.437656
EarthImager thumbnail JPEG image of line 1 resistivity profile.

Matlab thumbnail JPEG image of line 1 resistivity profile.
Sept. 6, 2006: Line L2F1, WRES = 0.405828
EarthImager thumbnail JPEG image of line 2 resistivity profile.
Matlab thumbnail JPEG image of line 2 resistivity profile.
Sept. 6, 2006: Line L3F1, WRES = 0.403102
EarthImager thumbnail JPEG image of line 3 resistivity profile.
Matlab thumbnail JPEG image of line 3 resistivity profile.
Sept. 6, 2006: Line L4F1, WRES = 0.442465
EarthImager thumbnail JPEG image of line 4 resistivity profile.
Matlab thumbnail JPEG image of line 4 resistivity profile.
Sept. 6, 2006: Line L5F1, WRES = 0.435033
EarthImager thumbnail JPEG image of line 5 resistivity profile.
Matlab thumbnail JPEG image of line 5 resistivity profile.
Sept. 6, 2006: Line L6F1, WRES =0.403637
EarthImager thumbnail JPEG image of line 6 resistivity profile.
Matlab thumbnail JPEG image of line 6 resistivity profile.
Sept. 7, 2006: Line L7F1, WRES =0.489463
EarthImager thumbnail JPEG image of line 7 resistivity and temperature profile.
Matlab thumbnail JPEG image of line 7 resistivity profile.
Sept. 7, 2006: Line L8F1, WRES =0.532664
EarthImager thumbnail JPEG image of line 8 resistivity and temperature profile.
Matlab thumbnail JPEG image of line 8 resistivity profile.
Sept. 7, 2006: Line F9L1, WRES =0.539642
EarthImager thumbnail JPEG image of line 9 resistivity and temperature profile.
Matlab thumbnail JPEG image of line 9 resistivity profile.
Sept. 7, 2006: Line F10L1, WRES =0.534571
EarthImager thumbnail JPEG image of line 10, file 1 resistivity and temperature profile.
Matlab thumbnail JPEG image of line 10, file 1 resistivity profile.
Sept. 7, 2006: Line L10F2_part2, WRES =0.523732
EarthImager thumbnail JPEG image of line 10, file 2, part 2 resistivity and temperature profile.
Matlab thumbnail JPEG image of line 10, file 2, part 2 resistivity profile.
Sept. 7, 2006: Line L11F1, WRES =0.495781
EarthImager thumbnail JPEG image of line 11 resistivity and temperature profile.
Matlab thumbnail JPEG image of line 11 resistivity profile.
Sept. 7, 2006: Line L12F1, WRES =0.493514
EarthImager thumbnail JPEG image of line 12 resistivity and temperature profile.
Matlab thumbnail JPEG image of line 12 resistivity profile.
Sept. 7, 2006: Line L13F1_part1, WRES =0.479921
EarthImager thumbnail JPEG image of line 13, part 1 resistivity and temperature profile.
Matlab thumbnail JPEG image of line 13, part 1 resistivity profile.
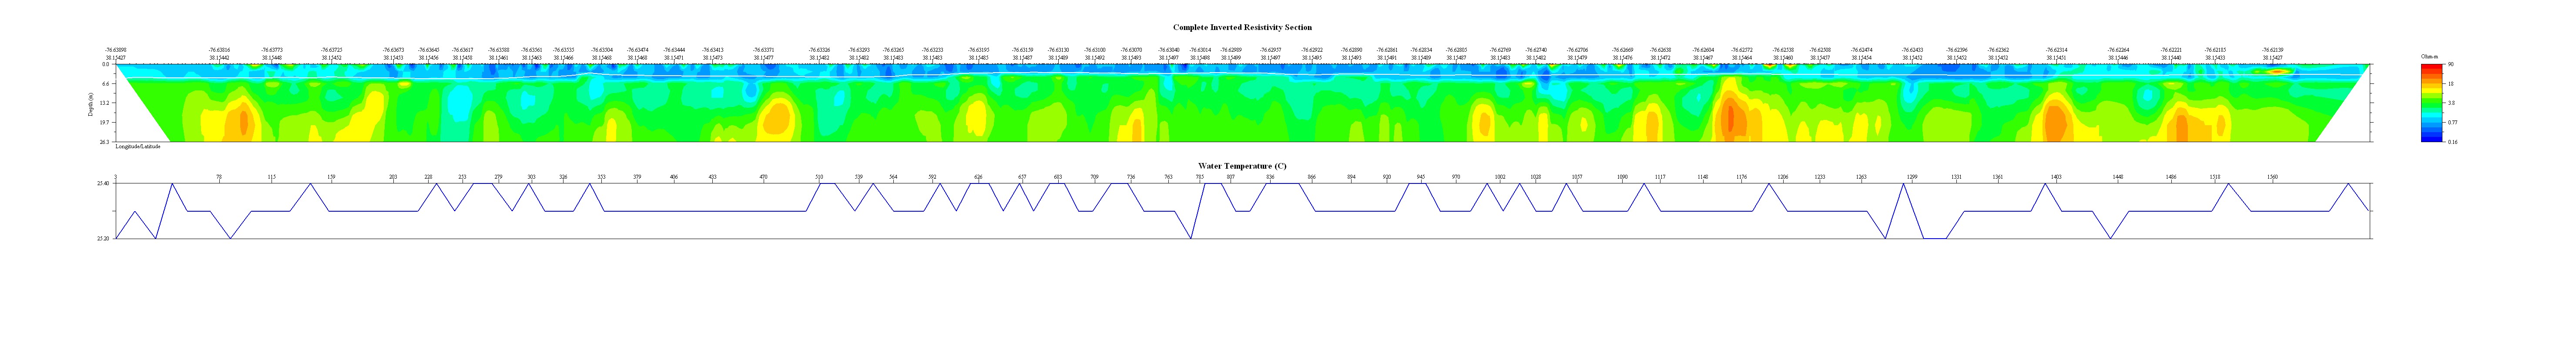
Sept. 7, 2006: Line L14F1, WRES =0.471518
EarthImager thumbnail JPEG image of line 14 resistivity and temperature profile.
Matlab thumbnail JPEG image of line 14 resistivity profile.
Sept. 7, 2006: Line L15F1, WRES =0.467265
EarthImager thumbnail JPEG image of line 15 resistivity and temperature profile.
Matlab thumbnail JPEG image of line 15 resistivity profile.
Sept. 7, 2006: Line L16F1, WRES =0.450344
EarthImager thumbnail JPEG image of line 16 resistivity and temperature profile.
Matlab thumbnail JPEG image of line 16 resistivity profile.
Sept. 7, 2006: Line L17F1, WRES =0.456589
EarthImager thumbnail JPEG image of line 17 resistivity and temperature profile.
Matlab thumbnail JPEG image of line 17 resistivity profile.
Sept. 7, 2006: Line L18F1, WRES =0.439294
EarthImager thumbnail JPEG image of line 18 resistivity and temperature profile.
Matlab thumbnail JPEG image of line 18 resistivity profile.
Sept. 7, 2006: Line L19F1, WRES =0.413360
EarthImager thumbnail JPEG image of line 19 resistivity and temperature profile.
Matlab thumbnail JPEG image of line 19 resistivity profile.
Sept. 8, 2006: Line L20F1, WRES =0.414020
EarthImager thumbnail JPEG image of line 20 resistivity and temperature profile.
Matlab thumbnail JPEG image of line 20 resistivity profile.
Sept. 8, 2006: Line L21F1, WRES =0.459400
EarthImager thumbnail JPEG image of line 21 resistivity and temperature profile.
Matlab thumbnail JPEG image of line 21 resistivity profile.
Sept. 8, 2006: Line L22F1, WRES =0.461953
EarthImager thumbnail JPEG image of line 22 resistivity and temperature profile.
Matlab thumbnail JPEG image of line 22 resistivity profile.
Sept. 8, 2006: Line L23F1, WRES =0.477592
EarthImager thumbnail JPEG image of line 23 resistivity and temperature profile.
Matlab thumbnail JPEG image of line 23 resistivity profile.
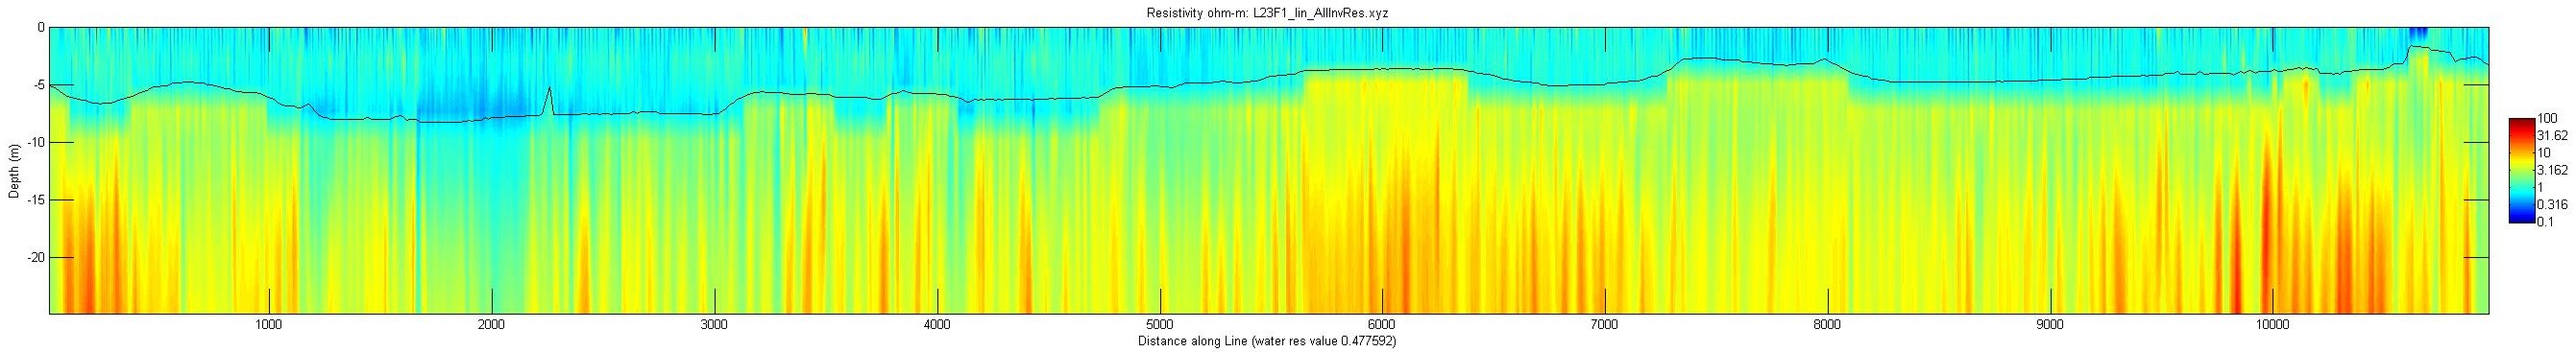
Sept. 8, 2006: Line L24F1, WRES =0.581521
EarthImager thumbnail JPEG image of line 24 resistivity and temperature profile.
Matlab thumbnail JPEG image of line 24 resistivity profile.
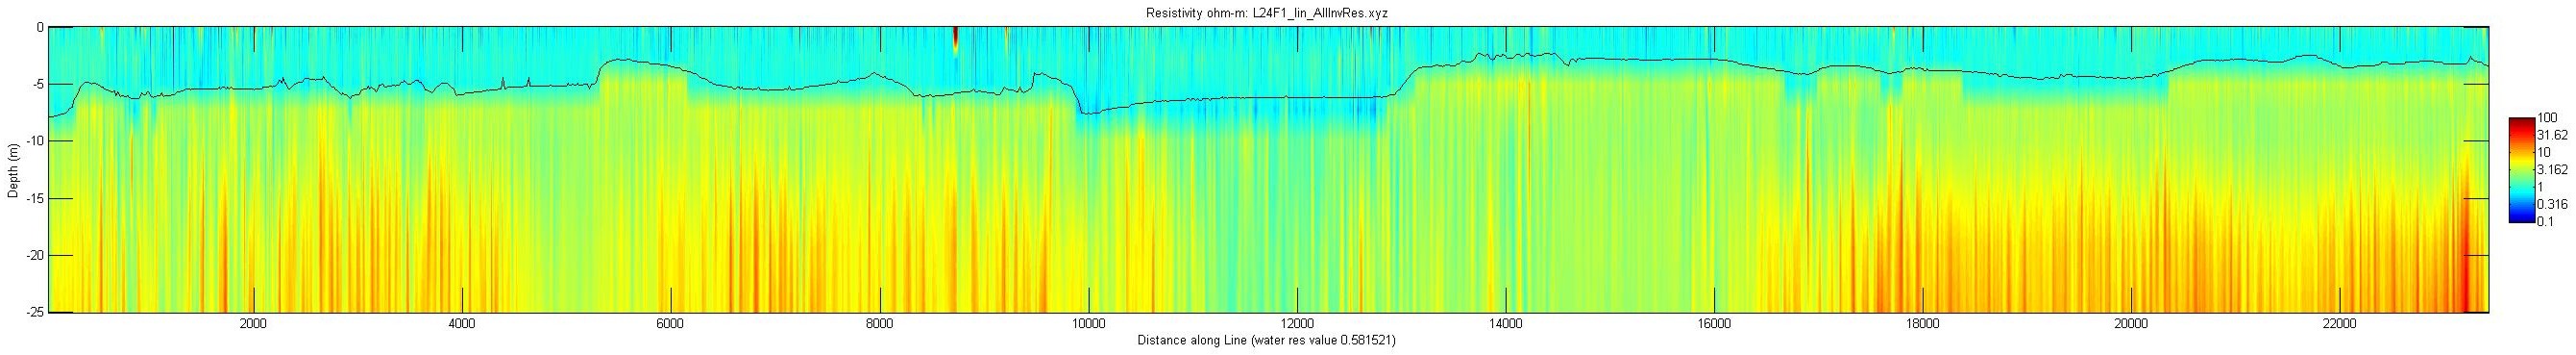
Sept. 8, 2006: Line L25F1, WRES =0.634390
EarthImager thumbnail JPEG image of line 25, file 1 resistivity and temperature profile.
Matlab thumbnail JPEG image of line 25, file 1 resistivity profile.
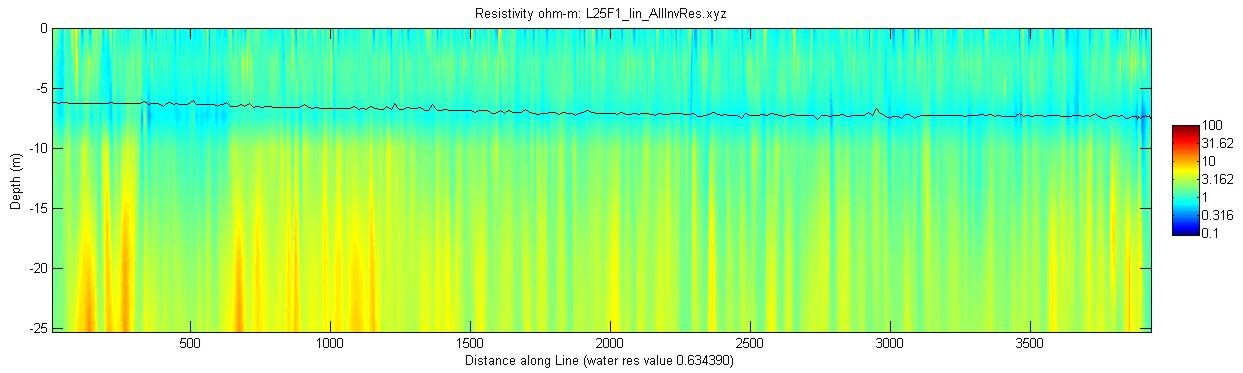
Sept. 8, 2006: Line L25F2, WRES =0.566971
EarthImager thumbnail JPEG image of line 25, file 2 resistivity and temperature profile.
Matlab thumbnail JPEG image of line 25, file 2 resistivity profile.
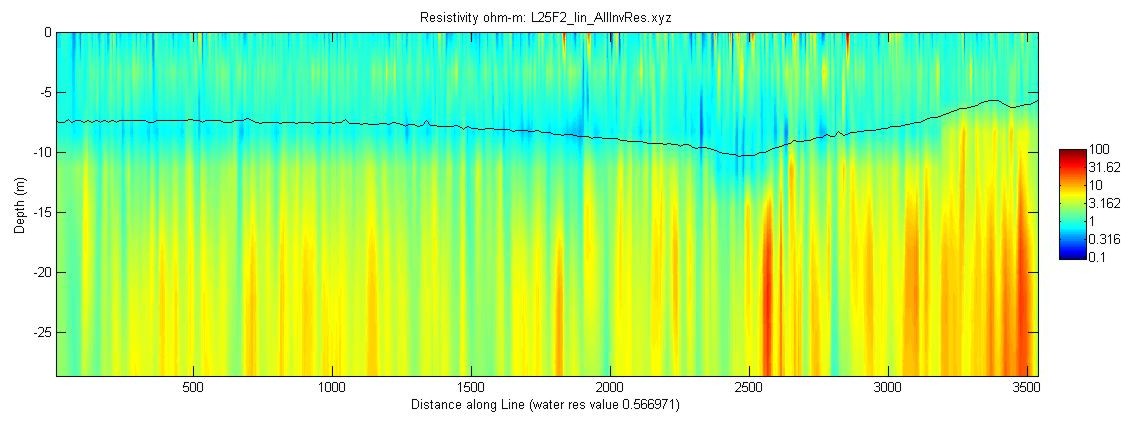
Sept. 8, 2006: Line L26F1, WRES =0.515970
EarthImager thumbnail JPEG image of line 26 resistivity and temperature profile.
Matlab thumbnail JPEG image of line 26 resistivity profile.
Skip USGS links group

Accessibility FOIA Privacy Policies and Notices

Take Pride in America logo USAGov logo U.S. Department of the Interior | U.S. Geological Survey
End of USGS links group