List of Figures- Click on figure for larger image.
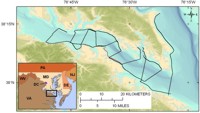
Figure 1. Location map showing the geophysical survey tracklines. The black lines indicate areas where both seismic-reflection and resistivity data were collected. The red lines indicate areas where only resistivity data were collected.
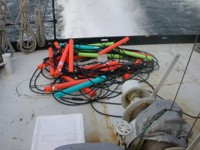
Figure 2. Continuous resistivity profile (CRP) streamer coiled on the deck of the survey vessel during transit. Foam flotation is attached to the cable between each electrode. Photo by John Bratton, USGS-GD-WHCMSC.
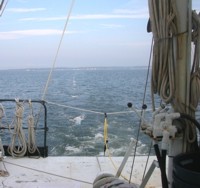
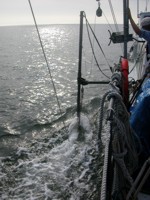
Figure 3. Continuous resistivity profile (CRP) streamer being towed behind the survey vessel. Photo by John Bratton, USGS-GD-WHCMSC.
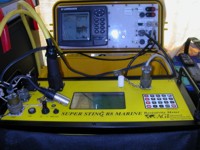
Figure 4. The Continuous resistivity profile (CRP) data acquisition system included the AGI SuperSting R8 Resistivity Meter (foreground) and the display screen of the Lowrance GPS-enabled fathometer. Photo by John Bratton, USGS-GD-WHCMSC.
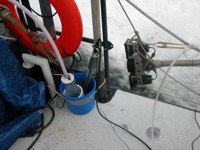
Figure 5. Seismic source and receiver attached to the port side of the survey vessel and pivoted out of the water during transit. The instrument shown on the right side of the blue bucket on the deck was used to measure the conductivity and temperature of surface water, which was pumped continuously into the bucket during surveying. Photo by John Bratton, USGS-GD-WHCMSC.
Figure 6. Seismic source and receiver deployed from the side of the vessel during surveying. Photo by John Bratton, USGS-GD-WHCMSC.
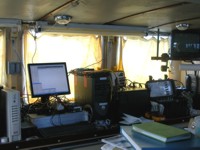
Figure 7. The seismic data acquisition system included a real-time data display and processors shown here. Photo by John Bratton, USGS-GD-WHCMSC.