U.S. Geological Survey Open-File Report 2010-1035
Geophysical Data Collected from the St. Clair River between Michigan and Ontario, Canada (2008-016-FA)
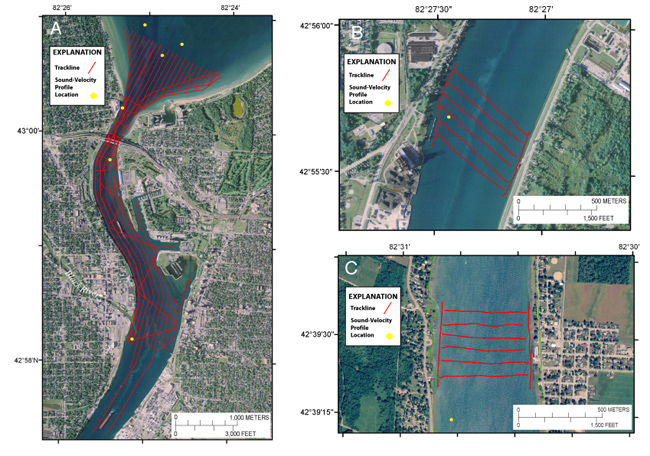 |
Figure 4. Image displaying the SWATHplus interferometric-sonar and Chirp subbottom profiler tracklines and sound-velocity profile locations: (A) in the northernmost St. Clair River area (Klein sidescan-sonar data also were collected along shore-parallel tracklines); (B) at Marysville, Mich.; and (C) at Port Lambton, Ontario. Tracklines are shown in red and sound-velocity profile locations are shown in yellow. 2005 orthophoto base from Michigan State University, Remote Sensing & GIS Research and Outreach Services, USDA–FSA Aerial Photography Field Office. After Foster and Denny, 2009. Click on figure for larger image.
|


