Skip past header information
USGS - science for a changing world

U.S. Geological Survey Open-File Report 2010-1035

Geophysical Data Collected from the St. Clair River between Michigan and Ontario, Canada (2008-016-FA)


Skip past contents informationTitle Page / Contents / List of Figures / Conversion Factors / Abstract / Introduction / Data Acquisition and Processing / Data Catalog / Acknowledgments / References Cited


Figure 9, Map showing the location and tracklines of video drifts, bottom photographs and samples collected by the USGS within the St. Clair River

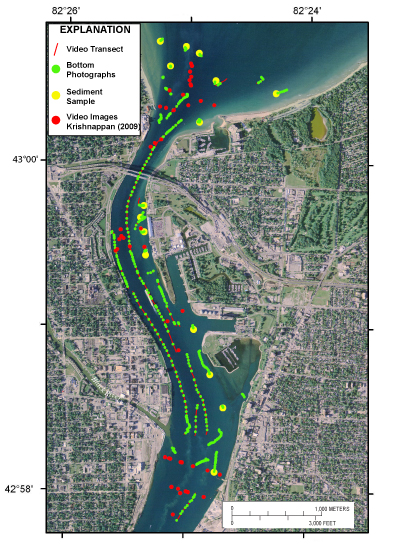
Figure 9. Map showing locations and tracklines of video drifts (red lines), locations of individual digital still photographs (green dots), and sediment-sampling locations (yellow dots) for data acquired with the Mini SEABOSS in the St. Clair River. The red dots show locations of selected observations of video along video transects from Krishnappan (2009). 2005 orthophoto base from Michigan State University, Remote Sensing & GIS Research and Outreach Services, USDA–FSA Aerial Photography Field Office. After Foster and Denny, 2009.

Download the full size image in PDF format (16 MB).


To view files in PDF format, download a free copy of Adobe Reader.


Skip USGS links group

Accessibility FOIA Privacy Policies and Notices

Take Pride in America logo USAGov logo U.S. Department of the Interior | U.S. Geological Survey
End of USGS links group