Skip past header information
USGS - science for a changing world

U.S. Geological Survey Open-File Report 2010-1091

High-Resolution Geophysical Data Collected Within Red Brook Harbor, Buzzards Bay, Massachusetts, in 2009


Skip past contents information/ Title Page / Acknowledgments / List of Figures / Conversion Factors / Abstract / Introduction / Data Acquisition and Processing / Data Description / References Cited / Appendix 1 /


Figure 6:  Map showing locations of Sound Velocity Profiles (SVP) collected during survey operations in Red Brook Harbor. Insets show SVP plots for casts six and eight. Plots display the speed of sound in the water column in meters per second on the x-axis, versus water depth in meters on the y-axis.


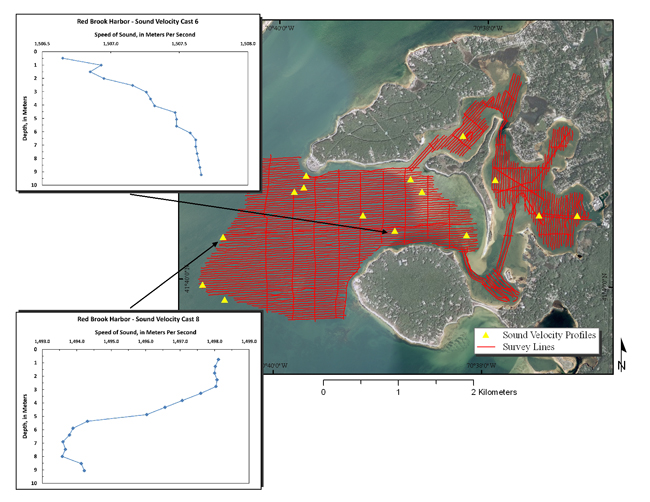
Figure 6. Map showing locations of sound velocity profiles (SVP) collected during survey operations in Red Brook Harbor, Massachussetts.  Inset plots show SVP for casts six and eight.  Plots display the speed of sound in the water column in meters per second on the x-axis versus water depth in meters on the y-axis.  (Aerial photography of land areas from Environmental Systems Research Institute (2010) World Imagery ArcGIS Map Service, aerial photography of water areas from [Massachussets] Office of Geographic Information (2010).)


Download the full size image in PDF format.


To view files in PDF format, download a free copy of Adobe Reader.


Skip USGS links group

Accessibility FOIA Privacy Policies and Notices

Take Pride in America logo USAGov logo U.S. Department of the Interior | U.S. Geological Survey
End of USGS links group