Skip past header information
USGS - science for a changing world

U.S. Geological Survey Open-File Report 2010-1091

High-Resolution Geophysical Data Collected Within Red Brook Harbor, Buzzards Bay, Massachusetts, in 2009


Data Description

Skip past contents information

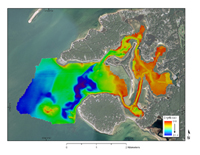
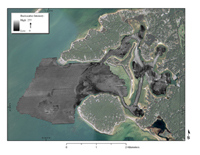
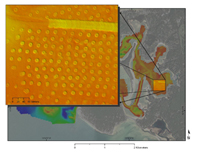
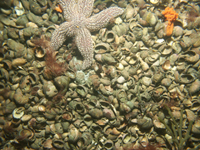
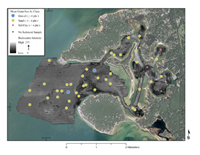
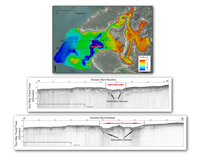
Depths range from 0 to approximately 10 m in the Red Brook Harbor survey area.  The very shallow inner harbor moorage area reaches a maximum depth of approximately 2.5 m, with a 3-m-deep dredged channel connecting it to the relatively deeper outer harbor and Buzzards Bay.  The inner harbor is densely pockmarked due to mooring blocks and associated sediment scour (fig. 12).  Much of the outer harbor is approximately 5 m deep.  The western edge of the survey area drops off to a depth of 9 m as it extends into Buzzards Bay.  The deepest portion of the survey area is a north-south trending channel 10.4 m deep, as measured by the interferometric sonar system.  Figure 7 shows a color-shaded relief image of the bathymetry of Red Brook Harbor.

Sediment samples collected in Red Brook Harbor indicate a predominantly sandy sea floor.  The mean grain size was sand (4 to -1 phi or 0.062 to 2 millimeters (mm) in diameter) at 88 percent of the sample stations, and sand-sized particles accounted for 75 percent by weight of all samples collected.  Only two sample stations, accounting for 5 percent of all samples, had a mean grain size of gravel (larger than -1 phi or greater than 2 mm in diameter), and both of these stations were located in the outer harbor.  Gravel-sized sediments comprised an average of 12 percent by weight of all samples acquired.  Muddy sediment (silt and clay, less than 4 phi or less than 0.0625 mm in diameter) was the mean grain size for 7 percent of the sediment samples, all located in the inner harbor.  Mud-sized grains comprised an average of 13 percent by weight of all sediment samples acquired.  The sea floor in much of the relatively deeper outer harbor is carpeted with Atlantic slippersnail shells, as illustrated by the photograph in figure 13.  Some areas of the inner harbor also have an abundance of these shells, although not to the degree found in the outer harbor.  Of the 48 stations occupied during sampling, thick shell cover prevented sample grabs at seven stations in the outer harbor.  Figure 14 maps the mean grain size for each sediment sample collected in Red Brook Harbor.

Backscatter intensity in Red Brook Harbor is lowest in areas of depth transition and in portions of the very shallow inner harbor.  The outer harbor has fairly uniform, moderate backscatter intensity, with the exception of low backscatter along the edges of a deeper north-south trending channel and higher backscatter in shoaler areas in the southern portion of the outer harbor.  The sea floor is texturally rough with boulders and cobbles in these higher backscatter shoal areas.  It is likely that backscatter changes in the outer harbor are masked by the abundance of slippersnail shells carpeting the sea floor.  For example, samples analyzed as gravelly sediment show the same backscatter intensities as samples analyzed as mostly sand; however, the sites where these samples were collected are covered by slippersnail shells.  Gravelly sediment generally exhibits higher backscatter values than sandy sediment.  Figure 8 shows a backscatter intensity mosaic for Red Brook Harbor.  Low backscatter values are represented by dark tones, while high backscatter returns are shown by lighter tones.

Seismic data collected within Red Brook Harbor appear saturated at the sea floor reflector due to a combination of the very shallow water depths and relatively coarse sediment found in the survey area.  However, subsurface features (such as channels) are visible in the seismic data throughout the survey area.  Figure 15 shows seismic profiles that were collected along two survey lines from west to east, perpendicular to a north-south trending channel.  Both profiles show subsurface channels approximately 3 to 7 m below the channel at the sea floor.

All spatial data related to this survey are available for download from appendix 1 (Geospatial Data).  Seismic SEG-Y data are not included for download but may be acquired by contacting the U.S. Geological Survey.

Figure 7:  Map showing a color-shaded relief image of the bathymetry of Red Brook Harbor, MA. Bathymetric soundings were collected with a Systems Engineering Assessment (SEA, 2010) SWATHplus interferometric sonar system. Depths are reported in meters and range from 0 to 10.3 meters. Figure 7. Map showing a color-shaded relief image of the bathymetry of Red Brook Harbor, Massachusetts. Bathymetric soundings were collected with an SEA (undated) SWATHplus interferometric sonar system. Depths are reported in meters and range from 0 to 10.4 meters. (Aerial photography of land areas from Environmental Systems Research Institute (2010) World Imagery ArcGIS Map Service, aerial photography of water areas from [Massachussets] Office of Geographic Information (2010).) Click on figure for larger image.

Figure 8:  Map showing backscatter intensity recorded with a Systems Engineering Assessment (SEA, 2010) SWATHplus interferometric sonar system during the USGS geophysical survey of Red Brook Harbor, MA. Low backscatter values are represented by dark tones, while high backscatter returns are shown by lighter tones. Figure 8. Map showing backscatter intensity recorded with an SEA (undated) SWATHplus interferometric sonar system during the U. S. Geological Survey geophysical survey of Red Brook Harbor, Massachusetts.  Low backscatter values are represented by dark tones, while high backscatter returns are shown by lighter tones.  (Aerial photography of land areas from Environmental Systems Research Institute (2010) World Imagery ArcGIS Map Service, aerial photography of water areas from [Massachussets] Office of Geographic Information (2010).) Click on figure for larger image.

Figure 12:  Inset map showing a large-scale view of the buoy blocks and surrounding scour in the inner portion of Red Brook Harbor. The inset map features a color-shaded relief image of the bathymetry that was recorded with a Systems Engineering Assessment (SEA, 2010) SWATHplus interferometric sonar system during the USGS geophysical survey of Red Brook Harbor, MA. Figure 12. Inset map showing a large-scale view of mooring blocks and surrounding scour in the inner portion of Red Brook Harbor, Massachusetts.  The location map features a color-shaded relief image of the bathymetry that was recorded with an SEA (undated) SWATHplus interferometric sonar system during the U.S. Geological Survey geophysical survey of Red Brook Harbor.  (Aerial photography of land areas from Environmental Systems Research Institute (2010) World Imagery ArcGIS Map Service, aerial photography of water areas from [Massachussets] Office of Geographic Information (2010).) Click on figure for larger image.

Figure 13:  Photograph showing dense Atlantic slippersnail cover which is present across much of the outer portion Red Brook Harbor. The photograph was acquired with the USGS MiniSEABOSS. Figure 13. Photograph showing dense Atlantic slippersnail shell cover, which is present in much of the outer portion of Red Brook Harbor, Massachussets.  The photograph was acquired with the U.S. Geological Survey Mini SEABOSS (Mini SEABed Observation and Sampling System). Click on figure for larger image.

Figure 14:  Map showing the mean grain size for each sediment sample, grouped into three classes: Gravel (-1 phi and larger, or 2 mm and larger), Sand (4 to -1 phi, or 0.062 to 2 mm in diameter), and Clay/Silt (less than 4 phi, or less than 0.0625 mm). The seven planned sample stations where it was not possible to collect a sediment sample are marked with black circles. The background image shows a backscatter mosaic. Figure 14. Map showing the mean grain size for each sediment sample, grouped into the following three classes:  gravel (larger than -1 phi or larger than 2 millimeters (mm) in diameter), sand (4 to -1 phi or 0.062 to 2 mm in diameter), and clay/silt (less than 4 phi or less than 0.0625 mm in diameter).  The seven planned sample stations at which it was not possible to collect a sediment sample are marked with small black circles.  The background image shows a backscatter mosaic.  (Aerial photography of land areas from Environmental Systems Research Institute (2010) World Imagery ArcGIS Map Service, aerial photography of water areas from [Massachussets] Office of Geographic Information (2010).) Click on figure for larger image.

Figure 15:  Map showing two seismic survey tracklines overlying a color-shaded relief image of Red Brook Harbor bathymetry. Both tracklines (A and B) were run from west to east. Corresponding seismic profiles show subsurface channels underlying the present-day channel floor. The x-axis in the seismic profiles is shown in shot points, and the y-axis is two-way travel time in seconds. Figure 15.  Map showing two seismic survey tracklines overlying a color-shaded relief image of Red Brook Harbor, Massachussets, bathymetry.  Both tracklines (A1-A2 and B1-B2) were run from west to east.  Corresponding seismic profiles show subsurface channels underlying the present-day channel floor.  The x-axis in the seismic profiles is shown in shot points, and the y-axis is two-way travel time in seconds.  (Aerial photography of land areas from Environmental Systems Research Institute (2010) World Imagery ArcGIS Map Service, aerial photography of water areas from [Massachussets] Office of Geographic Information (2010).) Click on figure for larger image.

Skip USGS links group

Accessibility FOIA Privacy Policies and Notices

Take Pride in America logo USAGov logo U.S. Department of the Interior | U.S. Geological Survey
End of USGS links group