Skip past header information
USGS - science for a changing world

U.S. Geological Survey Open-File Report 2010-1091

High-Resolution Geophysical Data Collected Within Red Brook Harbor, Buzzards Bay, Massachusetts, in 2009


Skip past contents information/ Title Page / Acknowledgments / List of Figures / Conversion Factors / Abstract / Introduction / Data Acquisition and Processing / Data Description / References Cited / Appendix 1 /


Figure 8:  Map showing backscatter intensity recorded with a Systems Engineering Assessment (SEA, 2010) SWATHplus interferometric sonar system during the USGS geophysical survey of Red Brook Harbor, MA. Low backscatter values are represented by dark tones, while high backscatter returns are shown by lighter tones.


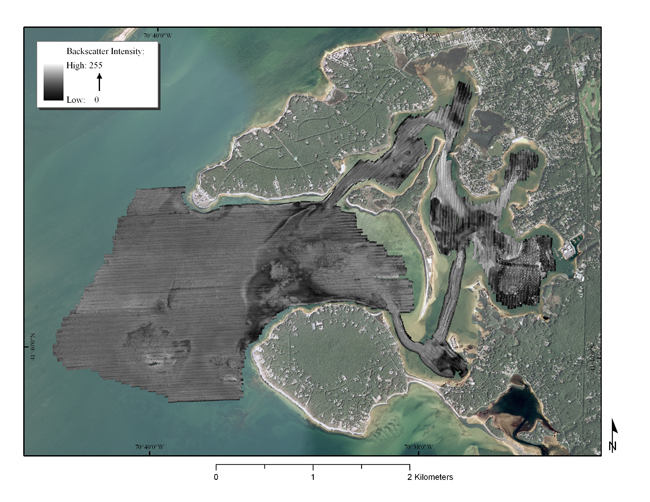
Figure 8. Map showing backscatter intensity recorded with an SEA (undated) SWATHplus interferometric sonar system during the U. S. Geological Survey geophysical survey of Red Brook Harbor, Massachusetts.  Low backscatter values are represented by dark tones, while high backscatter returns are shown by lighter tones.  (Aerial photography of land areas from Environmental Systems Research Institute (2010) World Imagery ArcGIS Map Service, aerial photography of water areas from [Massachussets] Office of Geographic Information (2010).)


Download the full size image in PDF format.


To view files in PDF format, download a free copy of Adobe Reader.


Skip USGS links group

Accessibility FOIA Privacy Policies and Notices

Take Pride in America logo USAGov logo U.S. Department of the Interior | U.S. Geological Survey
End of USGS links group