Skip past header information
USGS - science for a changing world

U.S. Geological Survey Open-File Report 2010-1091

High-Resolution Geophysical Data Collected Within Red Brook Harbor, Buzzards Bay, Massachusetts, in 2009


Skip past contents information/ Title Page / Acknowledgments / List of Figures / Conversion Factors / Abstract / Introduction / Data Acquisition and Processing / Data Description / References Cited / Appendix 1 /


Figure 15:  Map showing two seismic survey tracklines overlying a color-shaded relief image of Red Brook Harbor bathymetry. Both tracklines (A and B) were run from west to east. Corresponding seismic profiles show subsurface channels underlying the present-day channel floor. The x-axis in the seismic profiles is shown in shot points, and the y-axis is two-way travel time in seconds.


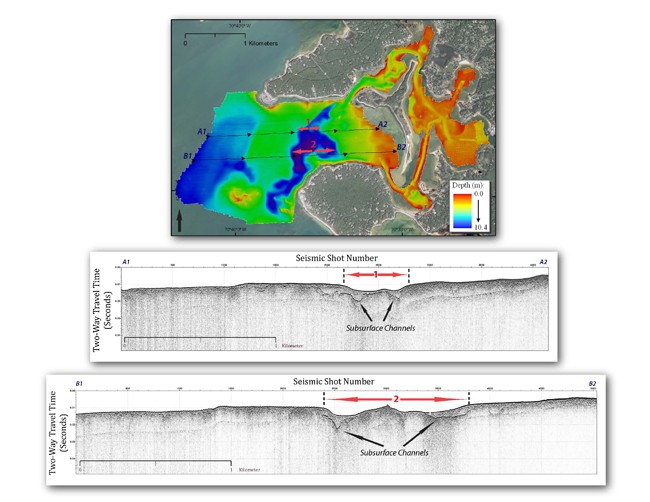
Figure 15.  Map showing two seismic survey tracklines overlying a color-shaded relief image of Red Brook Harbor, Massachussets, bathymetry.  Both tracklines (A1-A2 and B1-B2) were run from west to east.  Corresponding seismic profiles show subsurface channels underlying the present-day channel floor.  The x-axis in the seismic profiles is shown in shot points, and the y-axis is two-way travel time in seconds.  (Aerial photography of land areas from Environmental Systems Research Institute (2010) World Imagery ArcGIS Map Service, aerial photography of water areas from [Massachussets] Office of Geographic Information (2010).)


Download the full size image in PDF format.


To view files in PDF format, download a free copy of Adobe Reader.


Skip USGS links group

Accessibility FOIA Privacy Policies and Notices

Take Pride in America logo USAGov logo U.S. Department of the Interior | U.S. Geological Survey
End of USGS links group