U.S. Geological Survey Open-File Report 2010–1150
Sea-Floor Geology and Topography Offshore in Eastern Long Island Sound
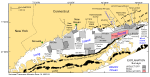
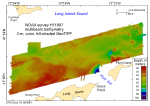
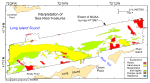
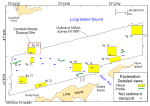
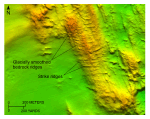
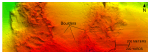
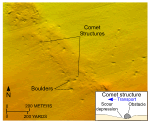
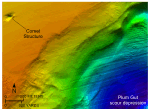
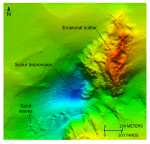
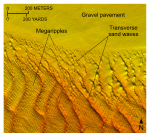
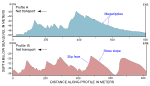
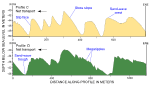
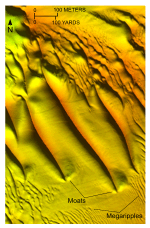
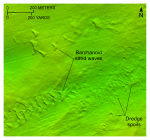
The study area extends along the thalweg axis of eastern Long Island Sound (figs. 1, 10). In general, depths shallow both along its northern and southern edges and to the west where the study extends over thicker marine deltaic deposits (Lewis and DiGiacomo-Cohen, 2000). The sound narrows toward the eastern part of the study, constricting the tidal flow and causing stronger bottom currents (Signell and others, 2000; White and White, 2009). These currents have scoured the sea floor and increased the depth through erosion. The greatest water depths surveyed within the study area exceed 108 m and lie at the northern entrance to Plum Gut, the passage between Orient Point and Plum Island (fig. 10). The shallowest areas, which are less than 16 m deep, occur along the southeastern edge of the study area. The high resolution of the digital terrain model (DTM) allows us to identify specific morphological features that indicate distinct sedimentary processes (fig. 11). The features identified in this dataset are reviewed in the following sub-sections. Bedrock Outcrops and Glacial MorainesRocky areas are concentrated in the eastern part of the study area and along its shallow southern edge. Extensive tidal- and storm-driven currents over the past 15,000 years have removed or winnowed much of the glacial and younger sediment that once filled eastern Long Island Sound (Lewis and Needell, 1987; Lewis and DiGiacomo-Cohen, 2000) and exposed bedrock outcrops and produced lag deposits of boulders and comet structures (Werner and Newton, 1975). Ice-sculpted bedrock is exposed at two locations in the northeastern part of the study area (figs. 12, 13). Characteristics that were used to delineate the bedrock include outcrops that influence the morphology of the sea floor and have an associated pattern of distinctive parallel ridges on the DTM. The distinctive ridges on the bedrock surface can be correlated with those of onshore formations. The northwest-southeast bedrock trends (fig. 13) are similar to glacially smoothed bedrock ridges that trend between N. 15° W. and N. 20° W. on land immediately west of the Thames River. These elongate ridges, which are similar in size, orientation, and morphology to their inferred offshore counterparts, parallel the interpreted direction of ice movement as shown by grooves and striations (Goldsmith, 1962). The second set of ridges that trend northeast-southwest (fig. 13) is similar to features onshore in southeastern Connecticut that trend between N. 65° E. and N. 80° E., and parallel the strike of foliation and the orientation of some jointing of the Avalonian anticlinorium (Rodgers, 1985). These ridges and their offshore counterparts were probably formed by glacial plucking and resemble strike ridges formed in dipping layered rock. Together, these lineations show that the effects of glaciation on the bedrock are evident on the sea floor of Long Island Sound. The northern flank of the Harbor Hill-Roanoke Point-Fishers Island end moraine segment underlies and crops out along the southern edge of the study area (fig. 1; Sirkin, 1982; Lewis and Needell, 1987; Poppe and others, 2002). Many small, individual, rounded bathymetric highs give the sea floor in this area a rough appearance and are interpreted to be boulders (figs. 12, 14). Although the boulders average less than 5 m in width, many exceed 10 m and the largest exceeds 20 m across. These rocky areas are lag deposits remaining from the winnowed sediments of the moraine. Three small rocky areas that generally trend east-west are present along the northern edge of the study area at 41° 13.2' N., 72° 22.0' W.; 41° 13.15' N., 72° 18.4' W.; and 41° 13.88' N., 72° 14.45' W. (fig. 11). We interpret these outcrops to be morainal deposits because they follow the trends of recessional moraines mapped across southeastern Connecticut (Schafer and Hartshorn, 1965; Flint and Gebert, 1976; Goldsmith, 1982; Stone and others, 2005) and, therefore, probably represent their offshore extensions. ScourScour provides evidence of ongoing erosion by the strong, oscillating tidal currents. For example, swirling currents develop around boulders that protrude through surficial sediments. Turbulence causes increased flow velocity sufficient to scour the sea floor downstream from obstructions and to produce coarse-sediment floored sharp-pointed depressions called obstacle marks, also known as comet marks (Werner and Newton, 1975). Good examples of these bedforms are present around boulders in the southern and western parts of the study area (figs. 12, 15, 16). Asymmetry of the scour around these boulders indicates that net transport is predominantly toward the west and farther into Long Island Sound (Reineck and Singh, 1980). Tidal currents, where enhanced owing to constricted flow, have also produced large scour depressions and a conspicuous erosional outlier (figs. 10, 16, 17). The largest scour depressions are present at the northern entrance to Plum Gut and adjacent to the erosional outlier located about 2.5 km north of Plum Island. Bottom video from station 997-21 in the scour depression north of Plum Island suggests that gravel armors much of the bottom in these features. However, gravel transported by currents may also be an abrading agent (Poppe and others, 2006b). As the swirling turbulent water in these fast eddies suspends and rolls gravelly sediment around in the depressions, impacts cause abrasion of the walls and floor. In this manner, erosion continues to enlarge the scour depressions. The erosional outlier north of Plum Island is covered by a lag deposit of boulders produced by the winnowing of glacial sediments. It is likely that this feature was originally part of the northern flank of the Harbor Hill-Roanoke Point-Fishers Island end moraine. Sand wavesTransverse bedforms dominate in a large sand-wave field that extends from the south-central edge to the northwestern corner of the study area (figs. 10, 11, 12). Small fields of these sand waves are also present northeast of Plum Island and on the wall of the scour depression at the northern entrance to Plum Gut (fig. 16). Crest-to-trough amplitudes of the largest transverse sand waves exceed 20 m, but these bedforms exhibit a range of amplitudes and crestline lengths. Current ripples occur on the flanks of the megaripples, megaripples occur on the flanks of sand waves, and sand waves occur on the flanks of larger sand waves (figs. 18, 19). Many transverse sand waves exceed 1 km in length, and several are longer than 1.7 km. Together, fields of transverse sand waves and megaripples account for over 35 percent of the sea floor within survey H11997. This percentage is greater than in the adjacent survey H11250 to the east where processes characterized by erosion or non-deposition are more prevalent (Poppe and others, 2007a), but less than in survey H11361 to the west where processes characterized by coarse bedload transport are more common (Poppe and others, 2007b). Wave-crest morphology is variable, and sand-wave fields with smoothly sinuous, undulating, bifurcating, and relatively straight crest forms occur. Borders of sand-wave fields can be rather abrupt and are typically fringed with megaripples; megaripples occur more commonly on the stoss slopes of sand waves near the centers of the fields (fig. 18). Bifurcation of the wave crests, where present, is most common near abrupt changes in the character or orientation of the fields. The sand waves reflect the strength of the bottom currents and can be used to indicate directions of net sediment transport (Allen, 1968; Ludwick, 1972; Allen, 1980). Most of the transverse sand waves display pronounced asymmetry with slip faces that are oriented toward the west and southwest and stoss slopes oriented to the east and northeast (figs. 19, 20). This asymmetry suggests a flow-transverse crest orientation and net sediment transport toward the west and southwest. Stoss slopes of the transverse sand waves average 3° to 4°; slip faces are steeper, ranging from 9 to 32°. Wavelengths of the transverse sand waves vary by wave amplitude, but average about 150 m, and wavelengths of the largest transverse sand waves exceed 400 m (figs. 19, 20). The presence of current ripples and megaripples on the sand waves (fig. 18) and the steepness of the slip faces suggest that this transport is active and that the sand waves are propagating under the present hydraulic regime (Dalrymple and others, 1978; Reineck and Singh, 1980; Allen, 1980). The presence of megaripples with crests oblique to trends of the underlying sand waves is evidence for flow separation and increased turbulence, which can promote increased sediment flux from the development of secondary flows (Allen, 1968). Whether the difference in orientation of sand waves and megaripples translates to variance in sediment transport directions or propagation time scales is uncertain. Although current ripples may reverse their orientation during semidiurnal tidal cycles because of the small volume of the ripples, no reversal in either the sand-wave or megaripple morphology was observed in the multibeam data of adjacent lines collected at different tidal stages. Whether this tidal independence of large bedform orientation is due to the spatial distribution of residual currents, or to an asymmetry of current velocities is also uncertain, but it does suggest that the larger bedforms are more stable and that they move over longer time scales. Transverse sand waves that are relatively straight crested, display no bifurcation, and are symmetrical in profile occur within a few small locations within the study area (fig. 21). Megaripples are typically absent from the stoss slopes of these waves, and their ends are marked by distinct scour zones or moats. These sand waves, which closely resemble bedforms described in Great South Channel and on the Canadian part of Georges Bank (Valentine and others, 2002; Todd and Valentine, in press), are probably immobile. Although present, crescent-shaped barchanoid sand waves are much less common than transverse morphologies, covering less than 2 percent of the study area. Individual barchanoid sand waves average less than 100 m wide, but the largest exceeds 465 m. These waves commonly align into elongate fields having smaller isolated waves concentrated in the eastern ends (figs. 22, 23). Westward within barchanoid wave fields, wavelengths increase, the fields widen, and the barchanoid waves become larger and coalesce into complex forms and highly curved ridges. The observed widening of the barchanoid sand-wave fields is probably caused by the propagation of younger waves off the horns of pre-existent waves situated up-drift in the transport regime (fig. 23). Relief of the barchanoid waves is typically 1 to 2 m. However, scour depressions, probably formed by roll vortexes, commonly occur in the troughs within the convex areas of the larger waves. If trough-to-crest amplitudes are measured from these depressions the waves appear larger, and a few of the largest barchanoid waves exceed 10 m. The presence of depressions is evidence for intense scour that occurs on the down-current sides of these sand waves. Because of this scour, the slip faces of both small individual and large complex barchanoid sand waves are commonly at or near the angle of repose (30° to 32°). Although the coalesced barchanoid bedforms retain their arcuate slip faces and relatively gentle stoss slopes, the horns are shortened, widened, and rounded. In places, barchanoid waves grade laterally into transverse morphologies. Regardless of size, location, and complexity, all of the barchanoid sand waves are concave westward, indicating net westward sediment transport because the horns migrate more rapidly than the wave's main body (McKee, 1966). The distribution of sand-wave types within the study area is controlled at least to some extent by the availability of sand. Transverse wave morphologies dominate where the sediment supply is more abundant. Seismic-reflection profiles show that an eroding marine deltaic deposit is the probable source of the sediment necessary for these bedforms (Lewis and Needell, 1987; Lewis and DiGiacomo-Cohen, 2000; Poppe and others, 2002; Poppe and others, 2007b). Conversely, barchanoid wave morphologies typically form in environments where the substrate is firm and the sediment supply is limited (Reineck and Singh, 1980). The seismic profiles also show that barchanoid sand-wave fields in the study area coincide with areas where the Holocene section is thin. Gravel PavementAside from the bedrock outcrops, glacial moraines, scour depressions, and sand-wave fields, much of the study area appears to be relatively flat and featureless in the DTM. In these areas, which are shown in white in the interpretive figure, strong tidal currents prevent the deposition of Holocene marine sediments and erode the finer fraction from older sediments, leaving exposed lag deposits of gravel to armor the sea floor (figs. 11, 18, 23). Although scattered small encrusting faunal forms are present on the rock surfaces of gravel pavements, larger sessile forms are absent, suggesting that the gravel is periodically mobilized. Anthropogenic FeaturesAnthropogenic influences on the bathymetry can be seen in three places in the study area. The wreck of the Cornfield lightship lies near 41° 12.3' N., 72° 20.5' W. in approximately 48 m of water. This ship sank on April 24, 1919, after a collision with a barge under tow. An asymmetrical scour depression around the shipwreck is evidence for net transport to the west in this section of the study area. Another wreck is that of a barge that lies near 41° 12.8' N., 72° 17.6' W. and sank in 42 m of water on January 24, 1936. The Cornfield Shoals Disposal Site (Wiley, 1996) is located in the northwestern part of the study area about 6.1 km south of Cornfield Point, Conn. (figs. 11, 12). Although this is a dispersive disposal site (that is, material dumped here is expected to be transported out of the area by bottom currents), diffuse spoil mounds and circular impact structures can still be identified in the DTM (fig. 22). Vertical relief of the largest spoil mound exceeds 1.1 m above the surrounding sea floor. |