U.S. Geological Survey Open-File Report 2011-1015
Quaternary Geophysical Framework of the Northeastern North Carolina Coastal System
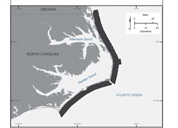
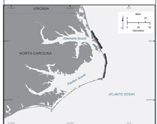
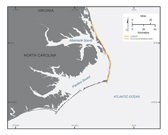
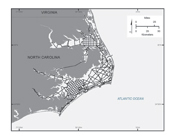
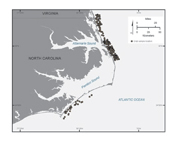
The geophysical datasets presented in this report were collected from numerous sources and multiple research endeavors. Various research cruises and surveys were undertaken to collect the seismic and acoustic datasets provided. Inner ShelfFrom 1999 to 2004 the USGS conducted six research cruises that acquired over 8,700 kilometers (km) of seismic, sidescan sonar, and bathymetric data along the inner shelf of North Carolina from False Cape, Virginia, to west of Cape Lookout, North Carolina (fig. 2). The inner shelf and lower shoreface were mapped using high-resolution sidescan sonar (100% coverage), interferometric swath bathymetry, subbottom profilers (Compressed High Intensity Radar Pulse or “chirp” and boomer systems), fathometer, and sediment grab sampler. The total surveyed area is 2,600 square kilometers (km2) and ranges in water depth from 7 meters (m) (mid-shoreface) to 28 m (inner shelf). NearshoreIn 2002 and 2005 a detailed bathymetric and geologic mapping study was done by project collaborators at VIMS in the nearshore region (1-8 m water depths) from 3 km north of Duck to Cape Hatteras (fig. 3). A Submetrix interferometric sidescan/bathymetry system and Edgetech Chirp 216 (2002) and 512i (2005) subbottom systems were used to collect 64 km2 of survey data. Objectives of this study were to (1) measure the thickness of modern sand, (2) map the surface sediment distribution, and (3) map the shoreface morphology (for example, large-scale sandbars) across the nearshore and the relation with regions in which large areas of underlying geology are exposed on the sea floor. Barrier IslandsTwo separate survey methods were used along the barrier islands of the North Carolina Outer Banks. Ground-penetrating radar was collected by researchers at ECU, and shoreline positions were surveyed using the USGS's SWASH (Surveying Wide-Area Shorelines) system (fig. 4). Ground-Penetrating Radar SWASH Back-barrier Coastal SystemHigh-resolution chirp and boomer subbottom profiling systems were used to map Albemarle and Pamlico Sounds (fig. 5). Mapping of the area was conducted in multiple research cruises from 2000 to 2004. The back-barrier study area includes over 3,400 km of boomer and 2,600 km of chirp seismic data. The back-barrier sounds and adjacent tributary estuaries were surveyed using the USGS research vessel, R/V Rafael and a pontoon vessel from East Carolina University referred to as the Doghouse. The Rafael platform provides rapid access to remote study areas and provides high-quality seismic data in a format that is directly compatible with data collected for the rest of the project. Geologic SamplesGrab samples were collected at 202 stations using a Van Veen grab sampler on many of the USGS inner shelf cruises to aid in the interpretation of acoustic datasets (fig. 6). The locations of all vibracores used in the interpretation and integration steps of the seismic datasets described above are provided in this report. The cores were collected by various agencies; most were not funded through this research project. Further information on the vibracore datasets can be found in separate publications listed in the metadata. Additional BathymetryThe National Geophysical Data Center (NGDC) assembled a gridded database referred to as the Coastal Relief Model (CRM) by merging USGS 3-arc-second digital elevation models with a compilation of hydrographic soundings covering the U.S. East Coast. The CRM extends from the coastal State boundaries to as far offshore as the data will support a continuous view of the sea floor at 3-arc-second resolution. The National Elevation Dataset (NED) is a seamless dataset maintained by the U.S. Geological Survey and comprised of the best available raster elevation data for the United States. The first priority of source data is quality, high-resolution data, typically derived from lidar or digital photogrammetry. Source data are selected from an expanding inventory of standard production USGS Digital Elevation Model (DEM’s), and also from an increasing number of datasets that are project- or agency-specific. Further information on the NED can be found at http://ned.usgs.gov/. The topography and bathymetry depicted in the GeoTIFF raster dataset provided in this report are a compilation and integration of the following data sources:
Two gridding errors in the NGDC data south of Cape Hatteras and north of Cape Lookout were corrected during data compilation. Further information on the NGDC CRM can be found at http://www.ngdc.noaa.gov/mgg/coastal/model.html. The SHOWEX experiment took place off of Duck, North Carolina in 1999. Further information on the SHOWEX experiment can be found at http://www.mmm.ucar.edu/abl/showex/.
|

![]() U.S. Department of the Interior |
U.S. Geological Survey
U.S. Department of the Interior |
U.S. Geological Survey
URL: http://pubsdata.usgs.gov/pubs/of/2011/1015/methods.html
Page Contact Information: GS Pubs Web Contact
Page Last Modified: Thursday, 08-Dec-2016 00:29:48 EST