Open-File Report 2011-1039
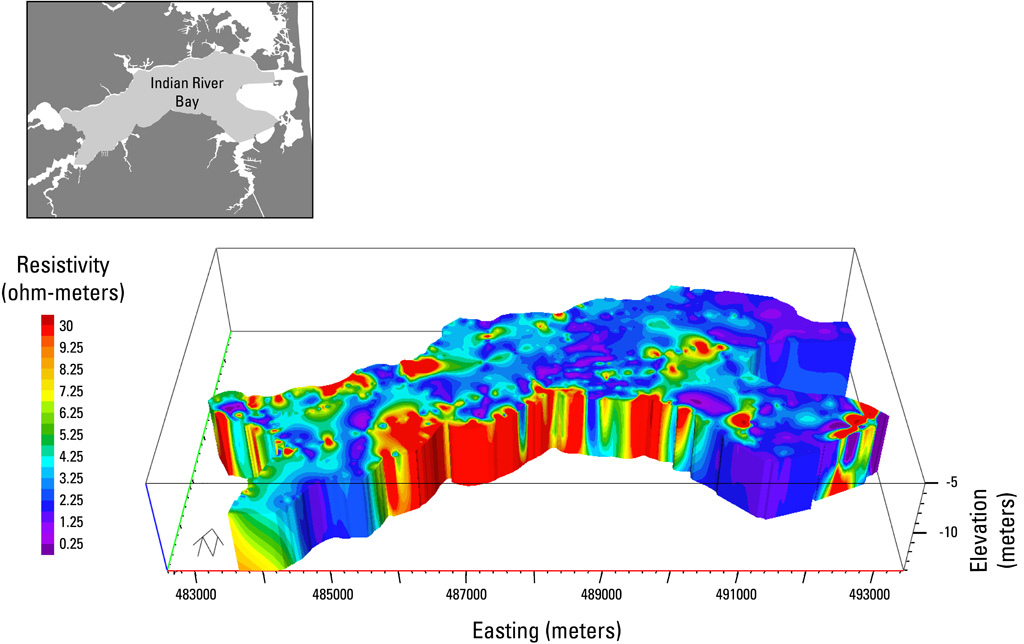 |
| Figure 5. Oblique view of a horizontal slice through a three-dimensional model developed using continuous resistivity profiling data from the Indian River Bay collected in April 2010. The top of the slice represents a constant depth of 8 meters below sea level. Warmer colors (yellow, orange, and red) represent regions with submarine groundwater of low salinity (high resistivity). The location map shows the bounds of the three-dimensional model in light gray. The Eastings represent Universal Transverse Mercator Zone 18 coordinates. Click on image for a larger version. |

![]() U.S. Department of the Interior |
U.S. Geological Survey
U.S. Department of the Interior |
U.S. Geological Survey
URL: http://pubsdata.usgs.gov/pubs/of/2011/1039/html/figurepages/ofr2011-1039-fig5.html
Page Contact Information: GS Pubs Web Contact
Page Last Modified: Thursday, 17-Jul-2014 05:19:00 EDT
