 |
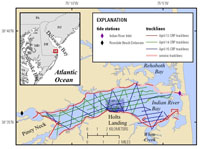
Figure 1. Location map showing the continuous resistivity profiling (CRP) tracklines of the survey in Indian River Bay, Delaware, in April 2010. A subset of these lines was also surveyed using a chirp seismic system (pink lines). |
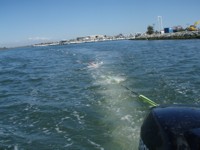 |
Figure 2. Photograph of the continuous resistivity profiling streamer deployed behind the survey boat. Foam flotation is attached to the cable between each electrode. Photograph by Adrian Green, U.S. Geological Survey. |
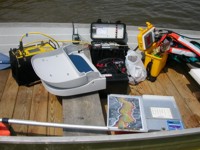 |
Figure 3. Photograph of the continuous resistivity profiling data acquisition system in a small survey boat (photograph is from a different survey). The yellow box on the left side of the photograph is the Advanced Geosciences, Inc. SuperSting R8 Marine resistivity meter, the black box in the middle manages the battery power to the system, and the yellow box on the right side contains the Lowrance Global Positioning System-enabled fathometer. Photograph by John Bratton, National Oceanic and Atmospheric Administration. |
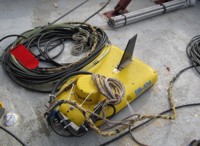 |
Figure 4. Photograph of the SB-424 chirp seismic towfish on the deck of a survey ship (photograph is from a different survey). Photograph by Charles Worley, U.S. Geological Survey. |
 |
Figure 5. Oblique view of a horizontal slice through a three-dimensional model developed using continuous resistivity profiling data from the Indian River Bay collected in April 2010. The top of the slice represents a constant depth of 8 meters below sea level. Warmer colors (yellow, orange, and red) represent regions with submarine groundwater of low salinity (high resistivity). The location map shows the bounds of the three-dimensional model in light gray. The Eastings represent Universal Transverse Mercator Zone 18 coordinates. |
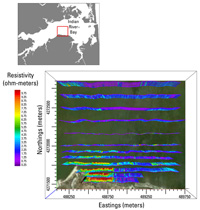 |
Figure 6. Perspective view from above of continuous resistivity processed data from the shore-parallel surveys collected off Holts Landing. The location map shows the bounds of the perspective view in Indian River Bay. The background orthophoto image was acquired from the Delaware Geological Survey (accessed May 2010, http://datamil.delaware.gov/). |
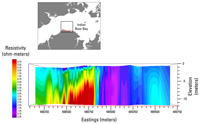 |
Figure 7. Cross-section view of a vertical slice through a three-dimensional model of the continuous resistivity profile data. The perspective is facing offshore (north). A high-resistivity (fresh groundwater represented by red colors) anomaly to the left (west) lies beneath a filled paleochannel shown in figure 8. The red line in the location map marks the position of the slice. Vertical exaggeration is 40x. |
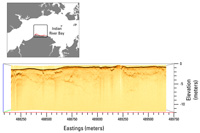 |
Figure 8. Chirp seismic-reflection profile collected near the Holts Landing shoreline along the same traverse (as indicated by the red line in the location map) and with the same perspective as figure 7. The seismic profile shows a complex paleochannel 2 to 4 meters deep on the left side of the image (west), which corresponds with the position of the high-resistivity anomaly shown in figure 7. Vertical exaggeration is 40x, 1500 meters per second was used to convert two-way travel times to depths. |

