U.S. Geological Survey Open-File Report 2012–1103
Sea-Floor Character and Geology Off the Entrance to the Connecticut River, Northeastern Long Island Sound
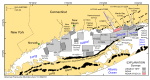
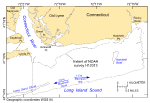
The U.S. Geological Survey (USGS), in cooperation with the National Oceanic and Atmospheric Administration (NOAA) and the Connecticut Department of Energy and Environmental Protection (CT DEEP), is producing detailed maps of the sea floor in Long Island Sound (fig. 1). The current phase of this cooperative research program is directed toward studies of sea-floor topography and its effect on the distributions of sedimentary environments and benthic communities. Because anthropogenic wastes, toxic chemicals, and changes in land-use patterns resulting from residential, commercial, and recreational development have stressed the environment of the sound and caused degradation and potential loss of benthic habitats (Koppelman and others, 1976; Long Island Sound Study, 1994), detailed maps and interpretations of the sea floor are needed to evaluate the extent of adverse impacts and to manage resources wisely in the future. The present study area covers 29.1 km² off the entrance to the Connecticut River in eastern Long Island Sound (fig. 2). The purpose of this report is to make available the backscatter and bathymetric imagery and digital terrain models (DTMs) derived from sidescan sonar and multibeam echosounder data collected in eastern Long Island Sound during NOAA survey H12013 and the data and interpretive data layers from 18 bottom sampling and photography stations occupied to verify these acoustic data. Basic data layers provided in the report include reconnaissance and interpolated raster grids, sun-illuminated imagery of sea-floor topography, and backscatter imagery from sidescan sonar. Although advances in multibeam echosounder technology permit the construction of high-resolution representations of sea-floor topography in deeper waters, limitations inherent in collecting fixed-angle multibeam data make using this technology in shallower waters (less than 10 m deep) difficult and expensive. Because of these limitations, line spacing during survey H12013 acquisition was such that the original multibeam datasets do not entirely cover the sea floor and areas of no data often are present between the ship's tracks. Gridding and interpolation were conducted at the USGS Woods Hole Coastal and Marine Science Center to provide bathymetric datasets with more complete coverage that provide a more continuous perspective. These datasets are provided as part of this report online and on DVD-ROM in Esri raster-grid and GeoTIFF formats in order to facilitate access, compatibility, and utility. Also provided are interpretive data layers that show the distribution of sedimentary environments and geologic features on the sea floor. Presented supplemental and verification data include sediment grain-size analyses and a gallery of still photographs of the seabed. These bathymetric, interpretive, and verification datasets serve many purposes, including (1) defining the topographic variability of the sea floor, which is one of the primary controls of benthic habitat diversity; (2) improving our understanding of the oceanographic processes that control the distribution and transport of bottom sediments and the distribution of benthic habitats and associated infaunal community structures; and (3) providing a detailed framework for future research, monitoring, and management activities. These datasets also serve as base maps for subsequent sedimentological, geochemical, and biological observations, because precise information on topography and environmental setting is important for the selection of sampling sites and for accurate extrapolation and interpretation of point measurements. |