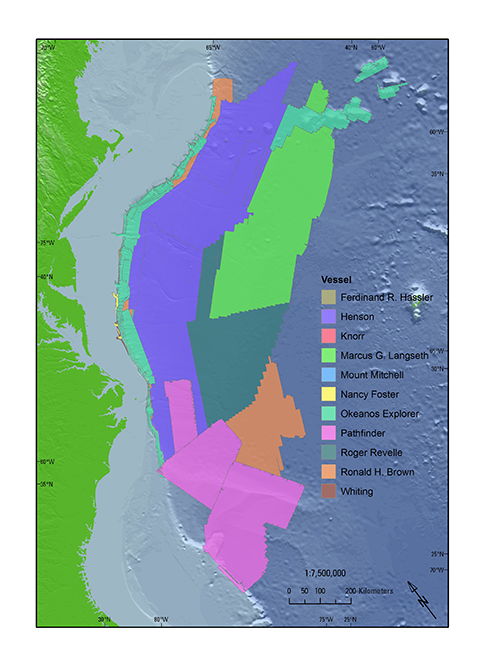
Figure 3. Map showing the source surveys (color coded by survey vessel) used to compile the final bathymetric terrain model and published as an Esri shapefile in this report. Surveys are listed in appendix 1. Land elevations in green and regional bathymetry in light blue are for basemap purposes only and are not published in this report. Data are from the U.S. Geological Survey and the National Oceanic and Atmospheric Administration National Centers for Environmental Information.
Download the full size image in PDF format.
To view files in PDF format, download a free copy of Adobe Reader.
|
