Open-File Report 2012-1266
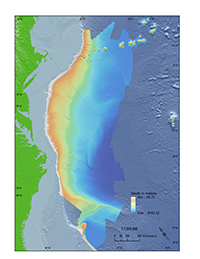
Bathymetric Terrain Model of the Atlantic Margin for Marine Geological Investigations
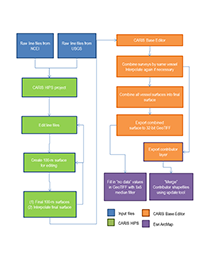
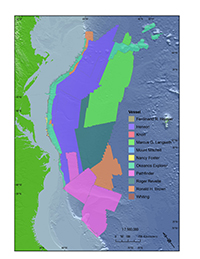
Common Processing MethodsThe methods used to access, process, and compile the BTM published in this report are described in this section (fig. 2). The first step in the process inventories all existing bathymetric data using the Web mapping service (WMS) of the NCEI (National Centers for Environmental Information, 2015). Individual surveys (fig. 3) covering areas seaward of the shelf break of the Atlantic margin of the United States were identified using the NCEI WMS. Initially, 54 individual surveys covering the area of interest were accessed; the number of surveys was later reduced to 32 for the final grid (fig. 1). Data Access and DownloadBathymetric line files in compressed format (MB-System format; Caress and Chayes, 2013) for each identified survey were downloaded from NCEI (see list of dataset download URLs in appendix 1). Three of these surveys (RB0904, NF-11-04-NC, and NF1208-USGS) were conducted by USGS scientists onboard National Oceanic and Atmospheric Administration (NOAA) vessels (appendix 1). The bathymetric line files for these three surveys were accessed in "raw.all" format by the USGS directly from the vessel during the survey and not downloaded from the NCEI. The USGS archived the line files from these three surveys after completion of the survey, and the NCEI converted the raw.all files to MB-System format for public access via the NCEI Web site. Data ProcessingThe CARIS Hydrographic Information System (HIPS) was used to process the line files after they were downloaded from NCEI and uncompressed. A new HIPS Project was started for each of the individual surveys and the line files were imported for each day (Julian calendar). All bathymetric line files were collected, archived with NCEI, and imported to HIPS, using the Geographic Coordinate System (GCS). Bathymetric files were collected using instantaneous sea level, and no additional tidal corrections were applied during import into HIPS. Instantaneous sea level indicates that the data collected were not referenced to a tidal datum, rather that the depths represent a height that is dependent on the local sea level at that location and time. Instantaneous Sea Level does not correlate to Mean Sea Level, however for comparison, the total tidal levels (tides, plus no-tidal sea surface heights above the geoid) range between -2.3 meters and 2.0 meters above the geoid for the period 1992-2011 (Egbert and Erofeeva, 2013). For each survey, an initial depth surface was produced as a base to edit the data. The depth surfaces were created using a Mercator projection which was more suitable for the spatial extent of this project than the GCS of the input line files. Several quality control steps were conducted to ensure that the final depth surfaces were free of depth spikes (erroneous data that would impact the quality of the final BTM) before combining the individual surfaces using CARIS Base Editor. Each survey line was reviewed and edited for bad soundings, and adjustments to the speed of sound corrections were applied if required. Depth and range filters were then applied using the Swath Editor feature within HIPS to eliminate erroneous soundings. After preliminary editing was completed, a final depth surface was produced and evaluated again for any remaining artifacts using both the three-dimensional (3D) editor and 3D viewer in HIPS. The spatial extent of each depth surface was created with adjacent survey data in mind so that it included the most suitable data in areas of overlap, and the spatial extent may not include all the data from each survey. This was a qualitative assessment to produce the cleanest regional coverage with the fewest artifacts from survey line orientation that would affect the quality of derivative products such as hillshade or gradient grids. If additional edits were required, then the final surface was rebuilt and interpolated to fill in any remaining small data gaps (fig. 2). Combining the individual surveys into one surface using Base Editor involved two basic steps: (1) surveys conducted by the same vessel were usually combined into a single surface, and (2) all surfaces were then combined into one final BTM of 100-meter (m) resolution, covering the extent of all surveys (fig. 2). Combining surveys from the same vessel is a logical first step; data acquisition techniques and equipment vary from vessel to vessel, thus different "vessel files" were used during the import of data into the CARIS HIPS software. Data collected with the same vessel but different surveys, for example, were combined into one base surface because they used the same sonar and acquisition methods. During the "Combine" process, the order of the input surfaces was controlled using one of several queries provided in Base Editor. For example, in most cases, separate surveys from the same vessel were combined using the query "where creation date is greatest;" therefore, in the areas where input base surfaces overlapped, the output surface was produced using the surface with the most recent creation date and older data were omitted in the overlap area. This method ensured that the most recent version of the surface was used. The second step combined the individual "vessel" surfaces using the "creation date is greatest" query to determine the surface order and produce a single final surface with a cell resolution of 100 meters per pixel (fig. 1). The "Combine" function in Base Editor also produces a "contributor" layer that records the extent of the input surface used as a source for each cell in the output surface. This is perhaps the greatest benefit of this method compared with previous bathymetric compilations in which the user cannot trace the source of the final compilation. This contributor layer is published in this report (in Esri shapefile format) as a record of the input surfaces used during the "Combine" function and is ultimately the source of each pixel in the final BTM, using the "Source" attribute in the "AtlanticMarginBathSource_V2" shapefile (see the Data Catalog section). The metadata that accompany the spatial data published in this report provide detailed descriptions of the methods and steps used to produce the final BTM and source polygon. The ability to control the input order and the combination of large overlapping bathymetric surfaces within hydrographic software is a relatively new technique within the CARIS software suite. Similar operations could be performed using geographic information system (GIS) software; however, the ability to manipulate these data in their near-native form (as soundings) with in CARIS software makes the process of combining datasets of different age and quality on a margin-scale more efficient than working in GIS software. Furthermore, this method facilitates periodic updates to the BTM as new bathymetric data are acquired. |

![]() U.S. Department of the Interior |
U.S. Geological Survey
U.S. Department of the Interior |
U.S. Geological Survey
URL: http://pubsdata.usgs.gov/pubs/of/2012/1266/methods.html
Page Contact Information: GS Pubs Web Contact
Page Last Modified: Wednesday, 18-May-2016 18:00:28 EDT