Open-File Report 2013-1020
High-Resolution Geophysical Data Collected Aboard the U.S. Geological Survey Research Vessel Rafael to Supplement Existing Datasets From Buzzards Bay and Vineyard Sound, Massachusetts
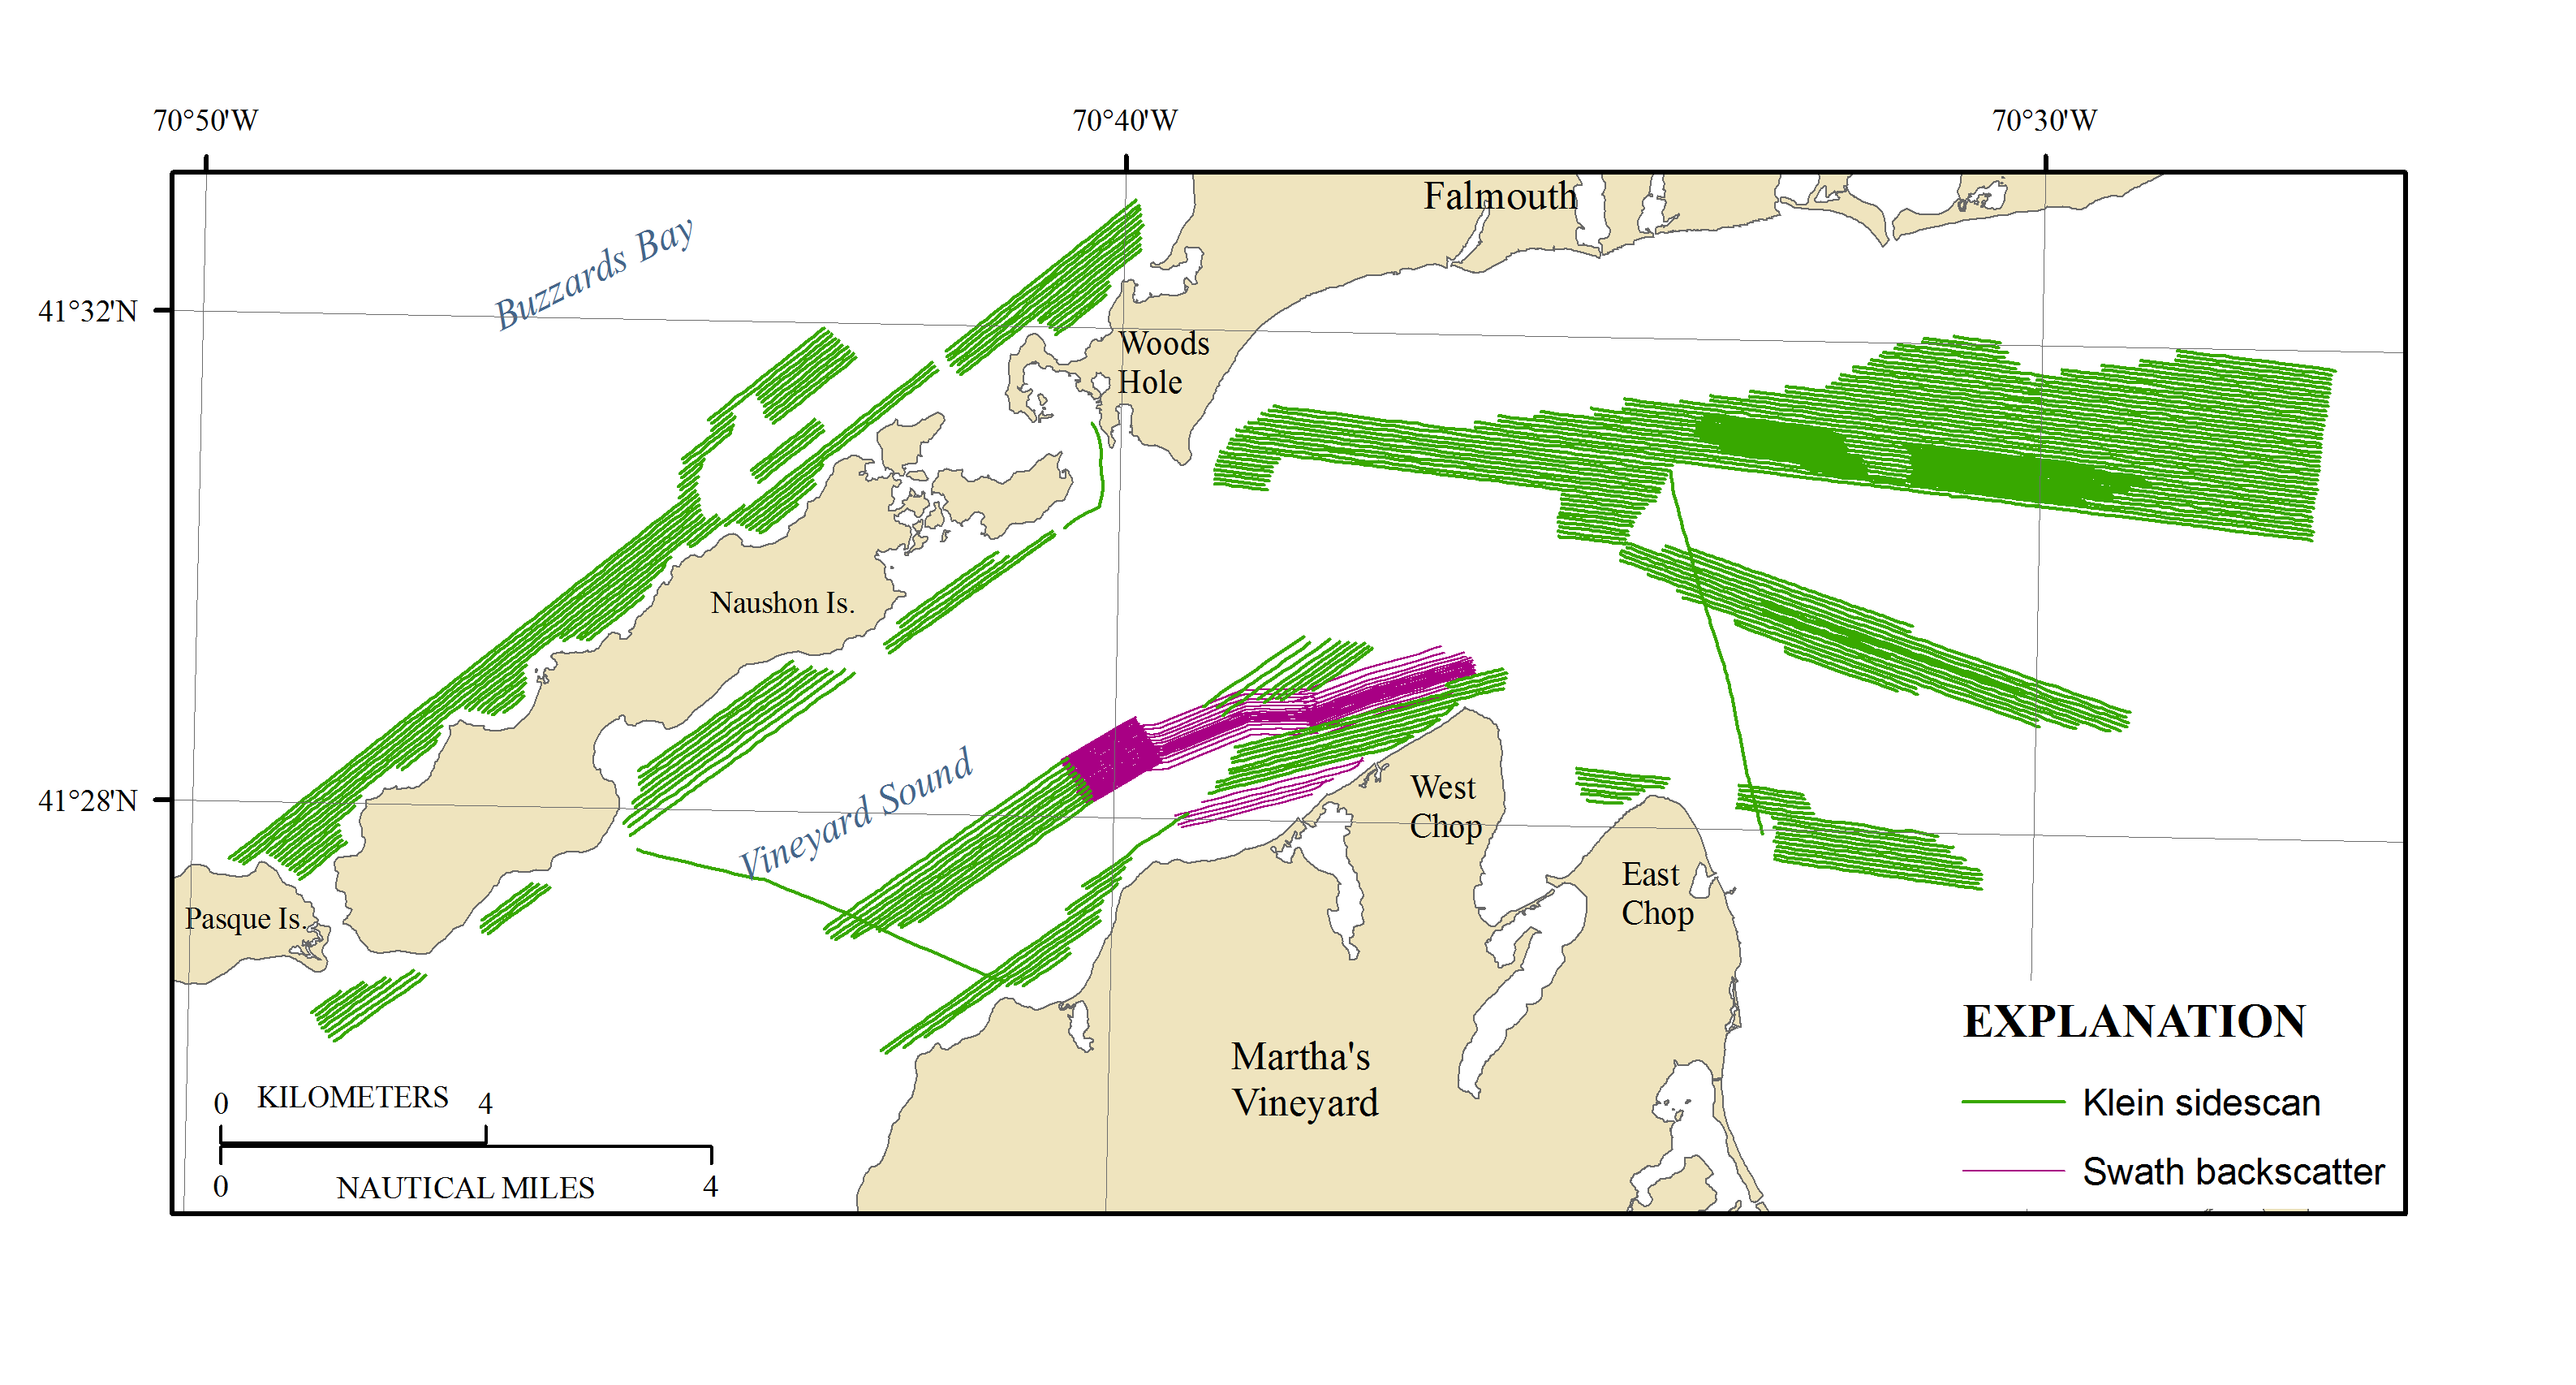
Figure 6. Map showing acoustic-backscatter intensity tracklines from both the Klein 3000 dual frequency sidescan sonar system (green) and the swath interferometric system (magenta) collected in Buzzards Bay and Vineyard Sound, Massachusetts during surveys 2011-013-FA, 2009-068-FA, and 2007-039-FA. Tracklines are color-coded by the collection system. Is., Island.


![]() U.S. Department of the Interior |
U.S. Geological Survey
U.S. Department of the Interior |
U.S. Geological Survey
URL: http://pubsdata.usgs.gov/pubs/of/2013/1020/html/imagepages/ofr2013-1020_Figure6.html
Page Contact Information: GS Pubs Web Contact
Page Last Modified: Wednesday, 12-Mar-2014 17:24:52 EDT
